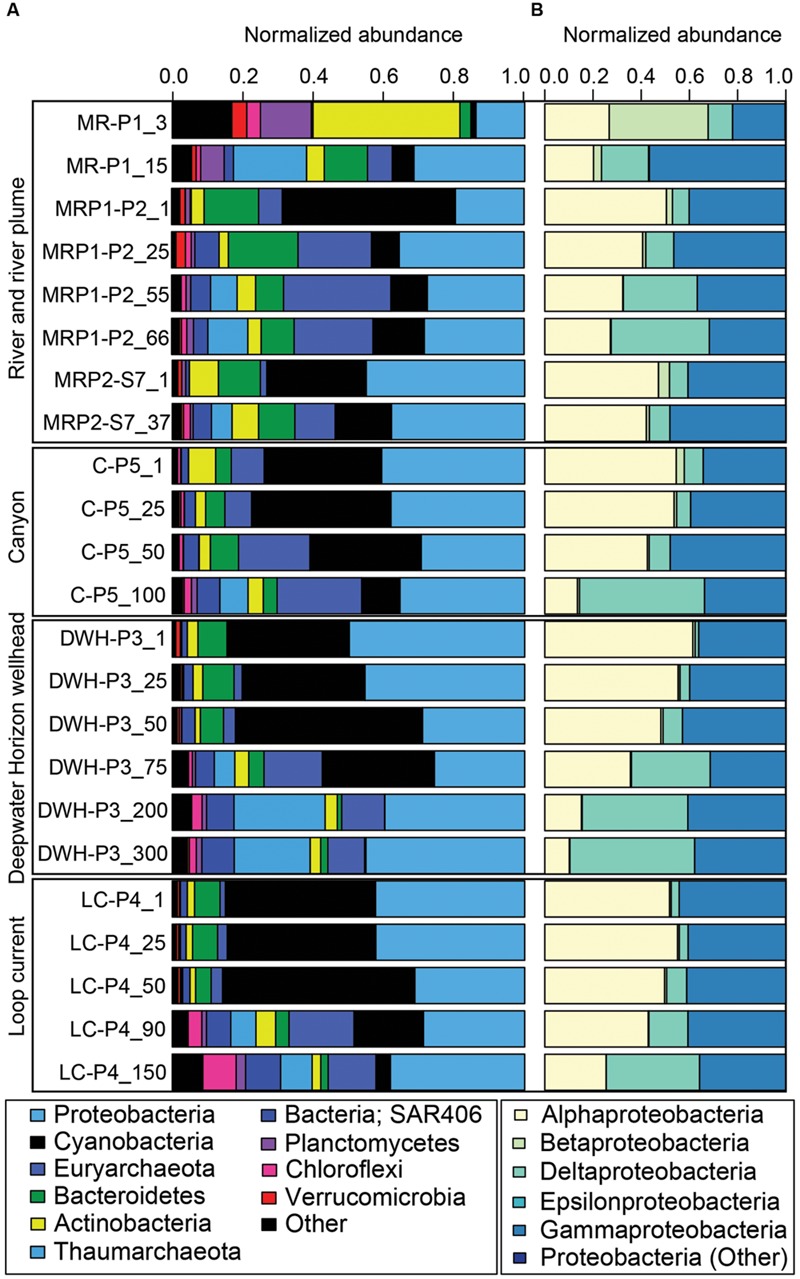
FIGURE 4.

Bar graph of normalized 16S rRNA gene sequence data. (A) Shows the relative abundance of the most abundant phyla. Less abundant phyla are grouped under “Other.” The figure key shows the highest (Proteobacteria) to lowest abundances (Other). (B) Shows relative abundance of the different proteobacterial sub-phyla. Less abundant proteobacterial sub-phyla are grouped under “Other.” The figure key shows the highest (Alphaproteobacteria) to lowest abundances (Proteobacteria; Other).
