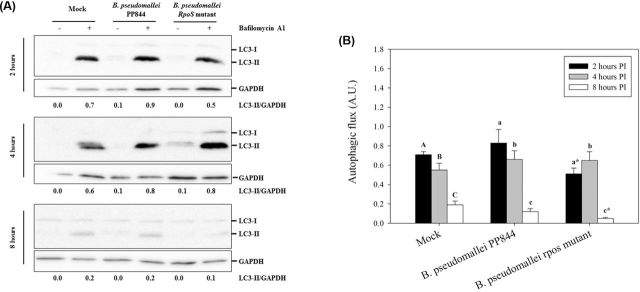
Figure 4.
Assessment of autophagic flux in HC04 cells. (A) Human liver HC04 cells were mock infected or infected with B. pseudomallei or its rpoS mutant at MOI 10 in the presence or absence of bafilomycin A1 and at 2, 4 and 8 h.p.i. expression of LC3-I (14kDa) and II (16kDa) determined by western blotting. GAPDH were used as a loading control for each condition. The intensity of LC3-II and GAPDH were determined using ImageJ software and the numbers below the blots show the ratio between LC3-II and GAPDH. (B) The plot of autophagic flux in HC04 cells as determined from A. Statistical analyses were undertaken using SigmaPlot 11.0 one-way ANOVA. Lower case letters indicate a significant difference from the corresponding upper case letters (P-value <0.05). Lower case letters with a star indicate that the rpoS mutant was statistically different from wild type.

