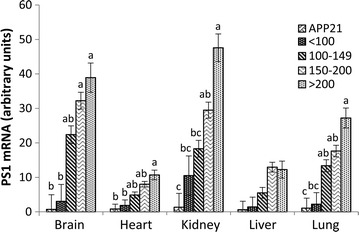
Fig. 2.

PS1 expression in founder animals and APP controls as determined by Northern blot analysis. The expression of PS1 was analyzed by combining animals with similar serum Aβ42 levels and statistical analysis conducted for each tissue. The figure legend indicates the range of serum Aβ42 level (pg/ml) of the founder animals or the APP control rats. Different letters above each bar indicates significantly different (p < 0.05) expression
