
FIGURE 3.
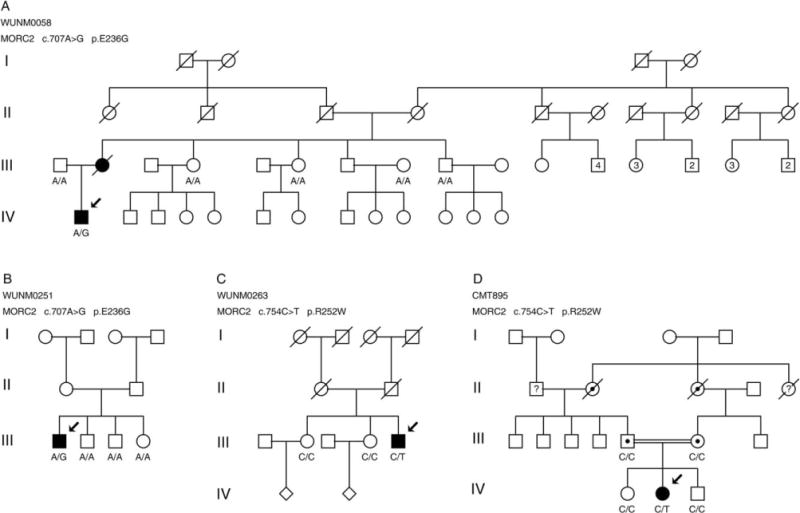
Segregation of the MORC2 mutations c.707A>G p.E236G (A, B) and c.754C>T p.R252W (C, D) in additional unrelated Charcot–Marie–Tooth disease type 2 families. The genotypes are shown below individuals who were available for genotyping. Solid symbols denote clinically affected individuals. Arrows denote the individuals in whom the MORC2 mutation was initially identified. Individuals in each generation are counted consecutively from left to right starting with 1.