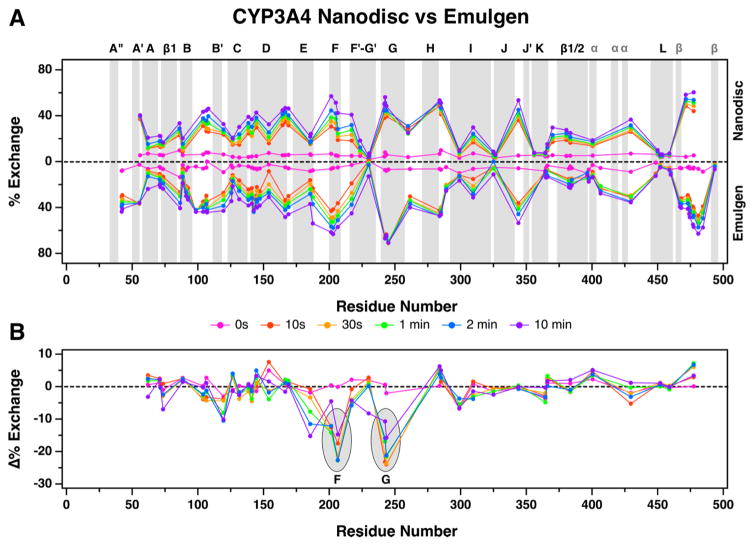
Figure 4.
HDX comparison of ligand-free CYP3A4 nanodiscs versus detergent solubilized CYP3A4. (A) The butterfly plot shows deuterium exchange profiles of ligand-free CYP3A4 nanodiscs (top) vs detergent solubilized CYP3A4 (bottom). Percent uptake for each time point is plotted at the midpoint of the primary sequence for each peptide. For example, uptake for the peptide spanning residues 33 to 51 is plotted at 42. The alpha-helices and beta-sheets are highlighted in gray and labeled above the plot. Generic “α” and “β” labels in gray are given to helices and sheets that are not named in this article, respectively. (B) A plot of the differences between matching peptides of CYP3A4 in nanodiscs and detergent solubilized CYP3A4 at each time point. The difference plot highlights regions of CYP3A4 nanodiscs that are more (positive value) or less (negative value) solvent accessible compared to detergent solubilized CYP3A4. Differences are not plotted when matching peptides do not exist between states. For example, no difference is calculated for the peptide spanning residues 33–51 because there was no peptide observed in that region for CYP3A4 nanodiscs.

