Fig. 1.

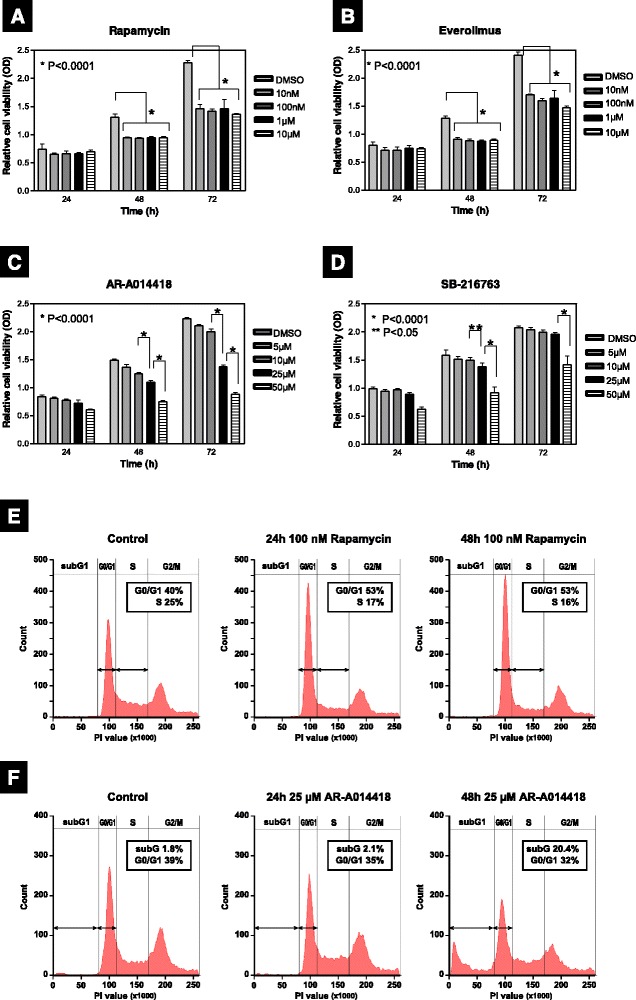
Differences in the suppressive effects of mTORC1 and GSK-3 inhibitors on cell proliferation. a–d Relative cell viability was measured by an MTS assay in ACHN cells treated with rapamycin (a), everolimus (b), AR-A014418 (c), and SB-216763 (d) at the indicated concentrations at 24, 48, and 72 h, respectively. Data are the mean ± SD in each bar-plot from six replicates of each cell line. e and f Cell cycle distribution in the presence of 100 nM of rapamycin (e) or 25 μM AR-A014418 (f) at 24 and 48 h. Data are representative of at least three independent experiments
