Figure 1.

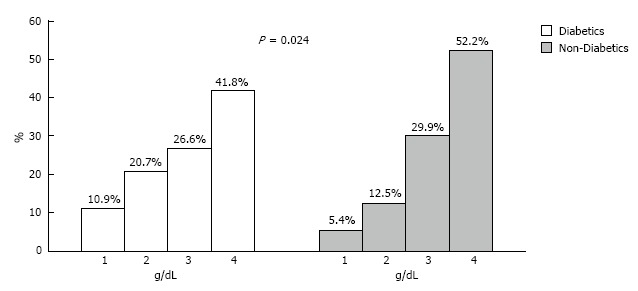
Distribution of serum hemoglobin levels in diabetic and non-diabetic patients. Percentages indicate the % of patients with hemoglobin levels within each depicted category of hemoglobin levels. 1: ≤ 11; 2: > 11-≤ 12; 3: > 12-<13; 4: ≥ 13.

Distribution of serum hemoglobin levels in diabetic and non-diabetic patients. Percentages indicate the % of patients with hemoglobin levels within each depicted category of hemoglobin levels. 1: ≤ 11; 2: > 11-≤ 12; 3: > 12-<13; 4: ≥ 13.