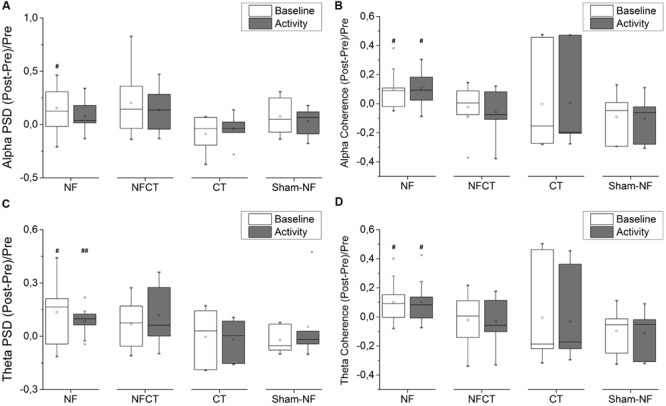
FIGURE 5.

Evolution of frontal EEG power spectral density (PSD) and frontal spectral coherence from pre- to post-training phase; (A) alpha and (C) theta PSD, on baseline and activity periods, in Fz channel, for NF (N = 9), NFCT (N = 8), CT (N = 7) and Sham-NF (N = 6) groups; NF group presented a statistically significant increase in basline alpha (p-value = 0.049) and both baseline and activity theta (p-value = 0.037 and 0.010, respectively, #p < 0.05, ##p < 0.01); for (B) alpha and (D) theta frontal spectral coherence (between FL and FR channel pools), for all four experimental groups. NF group presented a statistically significant increase in both baseline and activity alpha (p-value = 0.037 and 0.027, respectively) and in both baseline and activity theta (p-value = 0.049 and 0.049, respectively, #p < 0.05).
