
Figure 2.
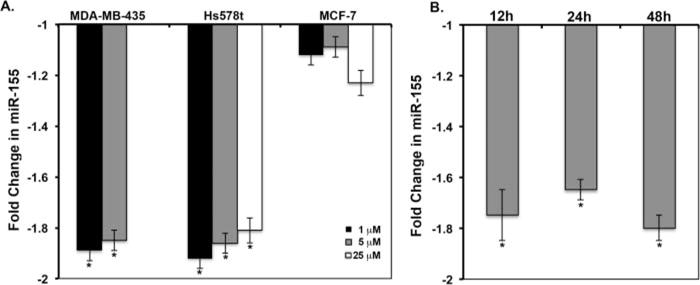
Expression of miR-155 in response to genistein. Quiescent MDA-MB-435, Hs578t, or MCF-7 cells were treated with vehicle or genistein, followed by RT-qPCR for miR-155. The comparative Ct method was used to calculate the relative abundance of miR-155 with respect to U6 RNA expression. Fold changes from vehicle are shown (N = 3 ± SD, *P < 0.05). A: Average fold change in miR-155 levels at 48 h following 0–25 μM genistein in MDA-MB-435, Hs578t, and MCF-7 cells. B: miR-155 expression in the MDA-MB-435 cell line in response to 5 μM genistein, as a function of time.