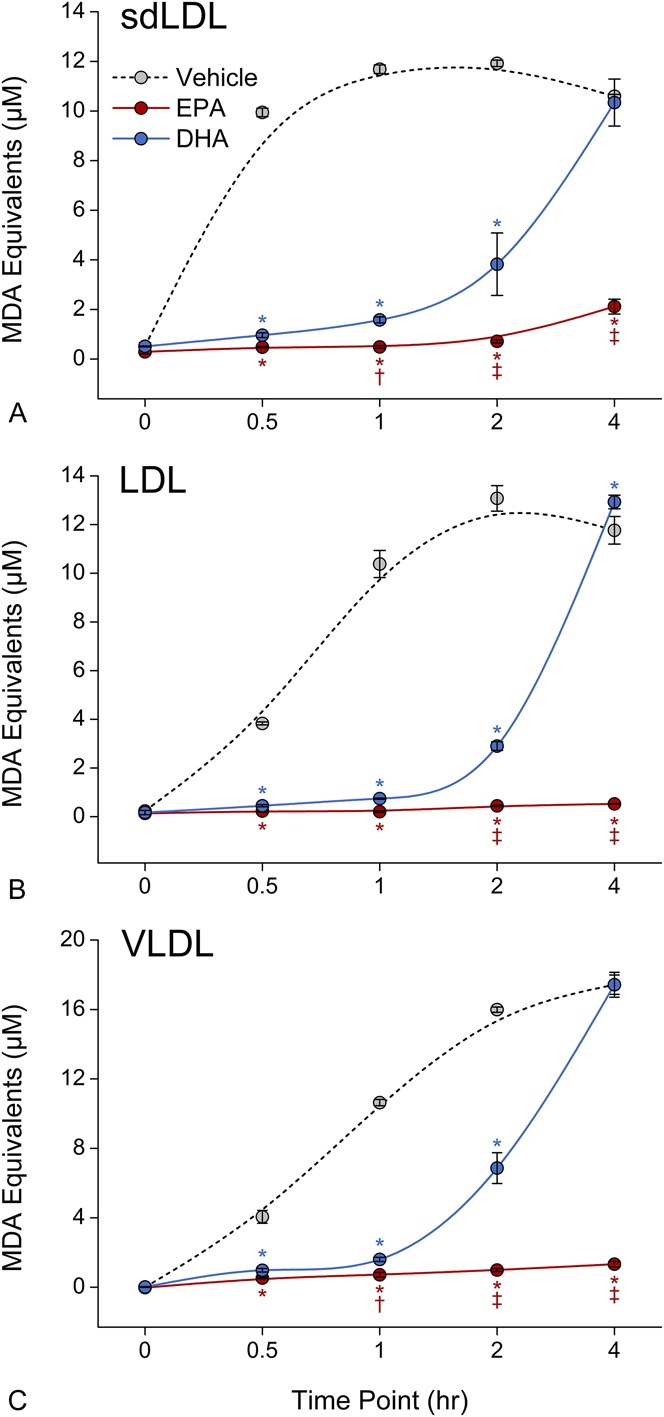
FIGURE 4.

Comparative effects of EPA and DHA on human sdLDL (A), LDL (B), and VLDL (C) oxidation. EPA and DHA were tested at 10 μM (sdLDL) and 2.5 μM (LDL and VLDL). Data were collected at various time points up to 4 hours following initial exposure to oxidative conditions. *P < 0.001 versus vehicle-treated control; †P < 0.05 and ‡P < 0.001 versus DHA (Student–Newman–Keuls multiple comparisons test; overall ANOVA—sdLDL data: P < 0.0001, F = 391.88; LDL data: P < 0.0001, F = 1191.3; VLDL data: P < 0.0001, F = 1074.8). ANOVA, analysis of variance; MDA, malondialdehyde.
