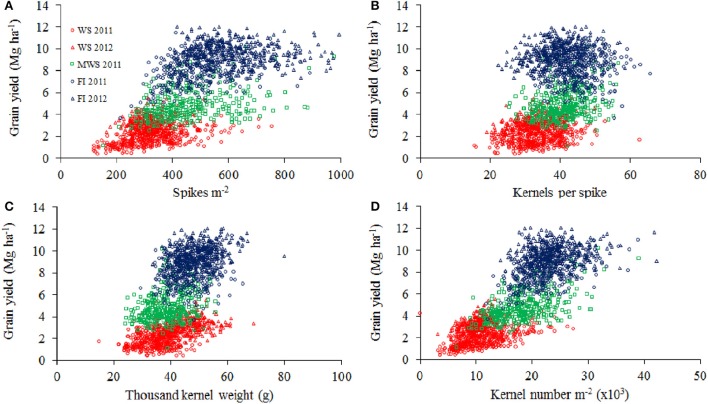
Figure 4.
| Grain yield | |||||
|---|---|---|---|---|---|
| WS 2011 | WS 2012 | MWS 2011 | FI 2011 | FI 2012 | |
| Spikes m−2 | 0.60 | 0.10 | 0.35 | 0.30 | −0.14 |
| Kernels spike−1 | 0.47 | 0.51 | 0.27 | 0.19 | 0.35 |
| Thousand kernel weight | 0.01 | 0.32 | 0.29 | 0.13 | 0.28 |
| Kernels m−2 (x103) | 0.75 | 0.46 | 0.53 | 0.50 | 0.16 |
Relationships between grain yield and spikes per m−2 (A), kernel per spike (B), thousand kernel weight (C), and kernel number per m−2 (D) of 378 genotypes of wheat grown under water stress (WS) in Cauquenes and mild water stress (MWS) and full irrigation (FI) in Santa Rosa, in 2011 and 2012. Pearson correlation values are shown in the table above.

