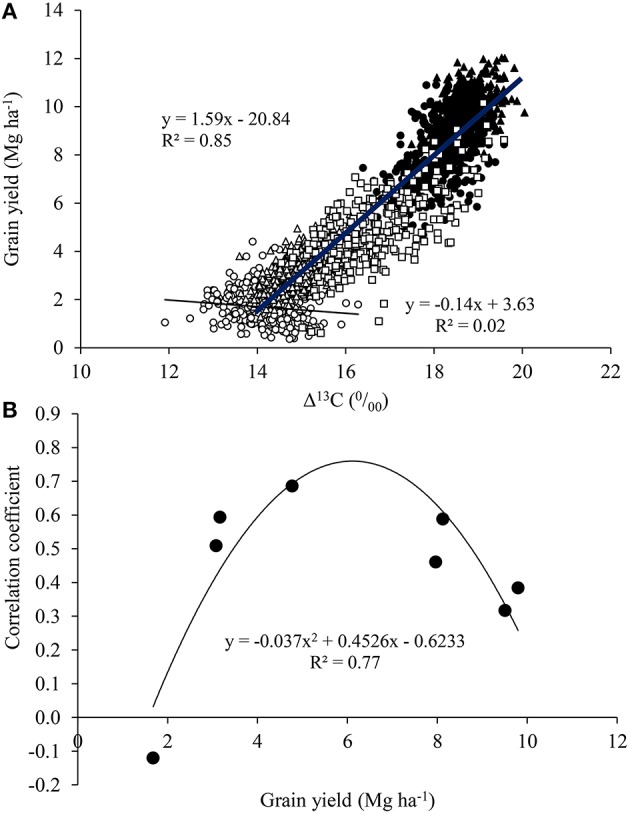
Figure 6.

(A) Relationships between grain yield (GY) and carbon discrimination in grains (Δ13C) for the set of 384 spring wheat genotypes grown under water stress (○, Δ), mild water stress (□) and full irrigation (•, ▴) conditions in 2011 and 2012. The negative regression is for water stress in 2011 and the positive one is for the rest of the environments. (B) The relationship between GY and correlation coefficients between GY and Δ13C for each replicate (block) and environment (WS, MWS and FI in 2011, and WS and FI in 2012).
