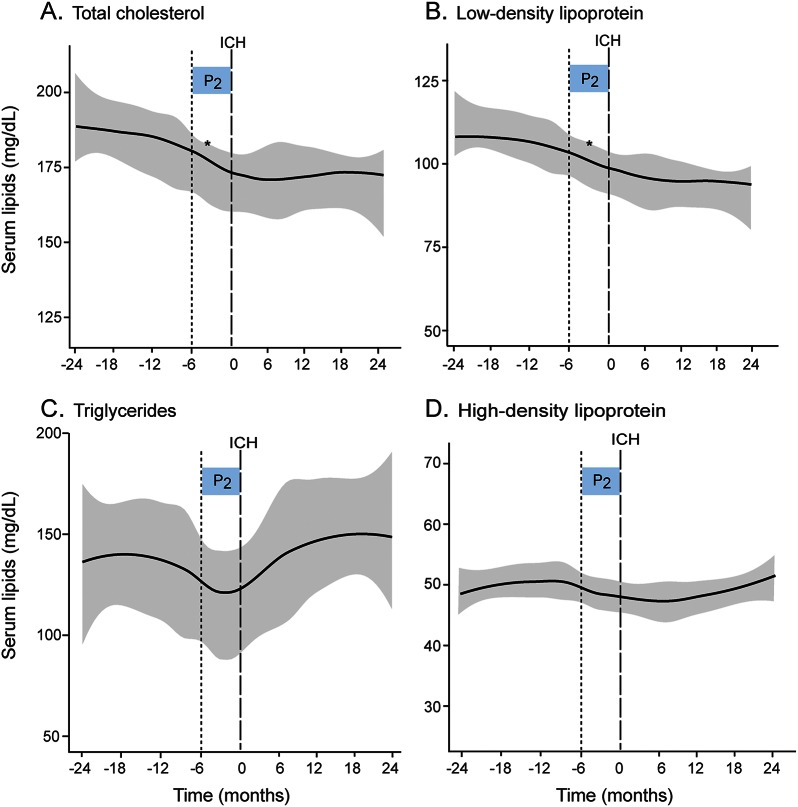
Figure 2. Temporal trends in individual serum lipid fractions in ICH patients.
(A–D) Loess smoothed curves of serum lipid levels (mg/dL) against time (in months) before and after ICH. Gray areas indicate standard error (SE). Time period of interest is indicated by shaded boxes (P2 0–6 months pre-ICH). *p < 0.0125, rate of change of serum lipids by Wald test for the time period P2. ICH = intracerebral hemorrhage.

