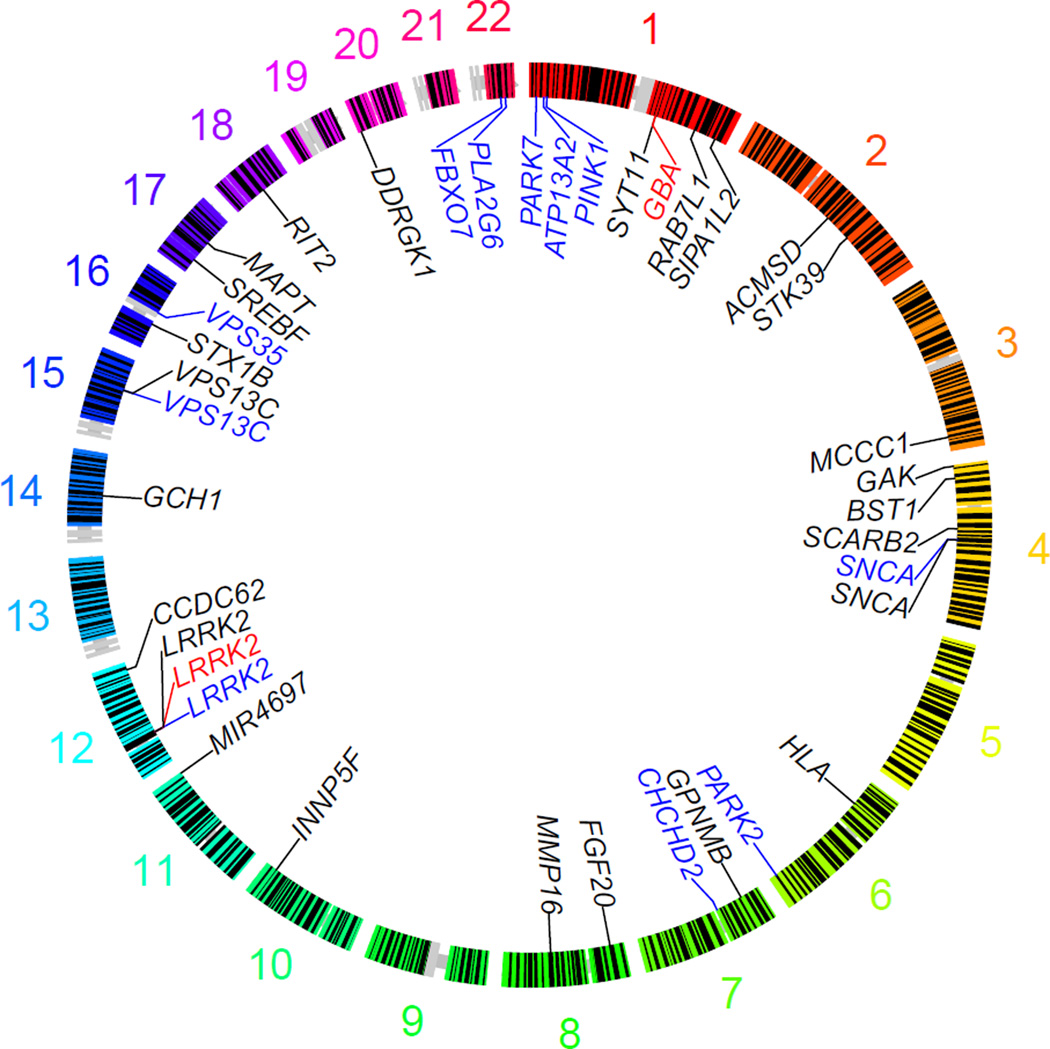
Figure 2.
Circular representation of the genome with genes and loci associated with PD indicated. Genes that contain causal mutations are shown in blue; genes that contain moderate effect protein coding risk alleles are shown in red; GWA identified loci that contain modest effect risk alleles are represented by proximal gene symbols in black.

