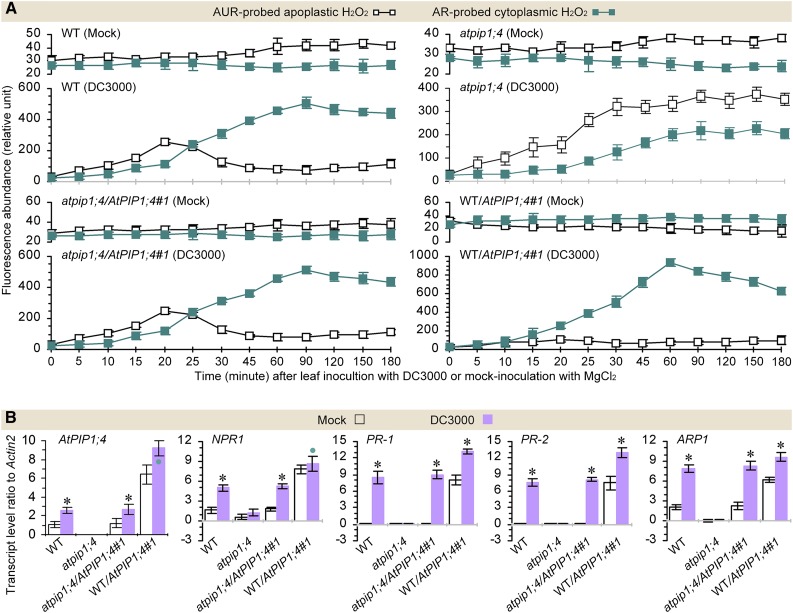
Figure 4.
AtPIP1;4 links pathogen-induced apoplastic H2O2 to the SAR pathway. A, Chronological changes in the H2O2-probing fluorescence densities in DC3000-inoculated and mock-inoculated leaves (mean ± se; n = 3). B, SAR gene expression levels in leaves 45 min after inoculation or mock inoculation (n = 6; *, P < 0.01 and •, P < 0.05 in paired comparisons between DC3000-inoculated and mock-inoculated plants). WT, Wild type.

