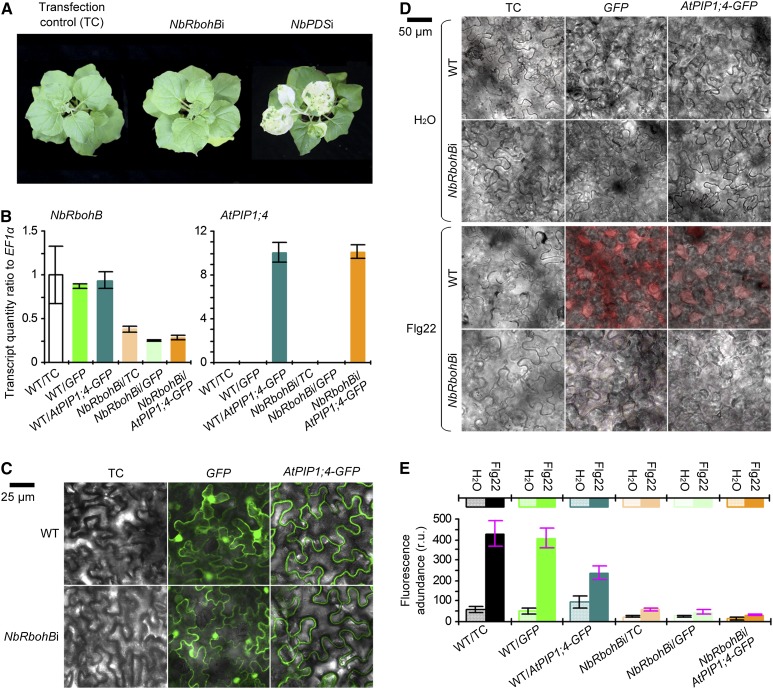
Figure 6.
NbRbohB gene silencing impairs apoplastic H2O2 generation. A, Plants 14 d after gene silencing. B, qRT-PCR analyses (n = 3). C, Imaging of leaves 36 h after transformation with GFP or AtPIP1;4-GFP. D, Cell imaging of AUR-stained leaves 30 min after treatment with water or aqueous flg22 solution. E, Quantification of fluorescence densities in leaves from D (n = 3). r.u., Relative units; WT, wild type.

