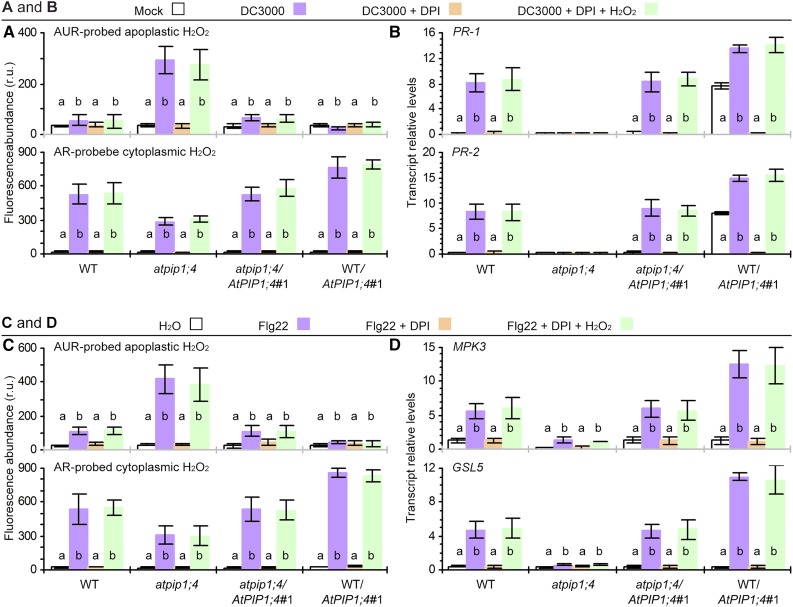
Figure 7.
NOX and AtPIP1;4 play independent roles in H2O2 production and translocation. A and B, H2O2 content and SAR gene expression in leaves 45 min after treatment with the indicated agents. C and D, H2O2 content and PTI gene expression in leaves 45 min after treatment with the indicated agents. Data are means ± se (n = 6); different letters on bar graphs indicate significant differences (P < 0.01) in multiple comparisons for every plant genotype. r.u., Relative units; WT, wild type.

