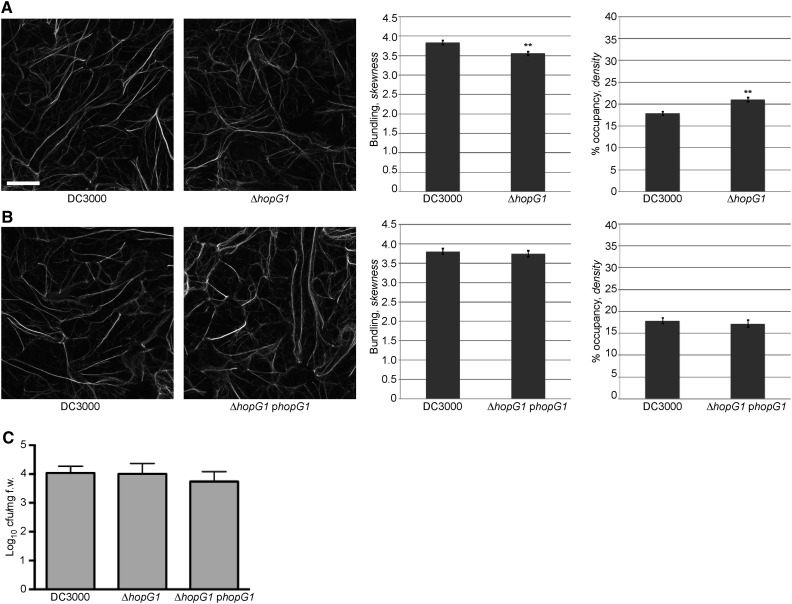
Figure 5.
Pathogen-induced actin bundling is suppressed in the hopG1 single mutant. Actin filament organization in 10-d-old Col-0/GFP-fABD2 cotyledons was observed at 24 h after dip-inoculation with the Pst DC3000, ΔhopG1, and Pst DC3000 ΔhopG1 + phopG1. A, Pst DC3000 ΔhopG1 and B, Pst DC3000 ΔhopG1 + phopG1. Pst DC3000 strains were inoculated at a concentration of 3 × 10⁷ cfu ml−1. Representative micrographs are shown. Actin skewness and density values were determined in 10-d-old Col-0/GFP-fABD2 seedlings at 24 h after dip-inoculation with Pst DC3000. Error bars represent mean ± se from the skewness and density values of seven independent biological repeats (n = 202–204) for A and three independent biological repeats (n = 71–74) for B. Statistical significance was determined using a Student’s t-test, as compared to Pst DC3000 wild type. **P < 0.001. Bar = 20 μm. C, In planta bacterial growth enumeration of Pst DC3000, the Pst DC3000 ΔhopG1 mutant, and the Pst DC3000 ΔhopG1 mutant complemented with hopG1 (i.e. ΔhopG1 phopG1). Bacterial growth was enumerated at 24 h after dip-inoculation at 3 × 10⁷ cfu mL−1. Bacterial growth assays were repeated twice. Error bars, representing mean ± se, were calculated from three (n = 6) technical replicates. Statistical significance was determined using a one-way ANOVA, Tukey test; P < 0.01.

