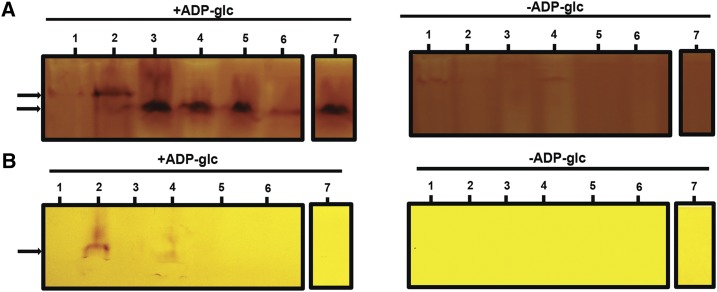
Figure 9.
Zymogram analysis of glycogen/starch synthase activities. Total proteins of crude extracts of the wild-type strain (WT), the 187G11 mutant strain, and the recombinant proteins GlgA2, a mixed of the crude extracts of the recombinant protein GlgA2 and the 187G11 mutant boiled or not, and the mixture (GlgA2 +187G11) incubated with amyloglucosidase or with protease, were separated by native PAGE containing 0.6 % (p/v) glycogen (A) or without glycogen (B). The native gels were then incubated with or without 3 mm ADP-Glc. Glycogen/starch synthase activities are seen after iodine staining as dark activity bands. The wild-type extracts display two bands (black arrows), a major band with high affinity to glycogen and a minor band with a low affinity to glycogen, that comigrate with the recombinant protein GlgA2. Numbered bars are as follows: 1, 187G11; 2, the wild type; 3, GlgA2; 4, GlgA2 + 187G11; 5, GlgA2 + 187G11 boiled extract; 6, GlgA2 + 187G11 treated with amyloglucosidase and boiled; and 7, GlgA2 + 187G11 treated with protease.

