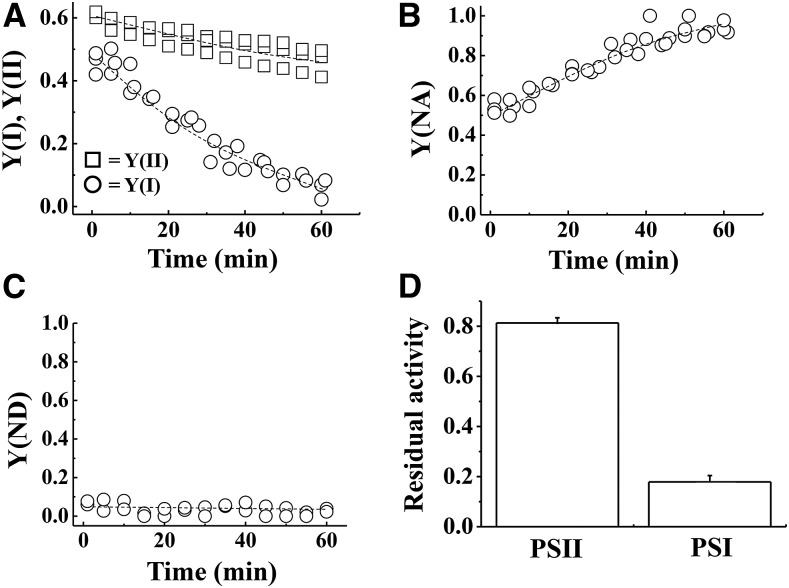
Figure 1.
A to C, Time-course analysis of photosynthetic parameters [A, Y(I) and Y(II); B, Y(NA); C, Y(ND)] in isolated chloroplasts. The reaction mixture contained 30 μg ml−1 isolated chloroplasts. Isolated chloroplasts were illuminated every 10 s with a short-pulse (300 ms, 20,000 μE m−2 s−1) and for 1 h without AL illumination at 25°C. Experiments were repeated three times. D, After rSP treatment, the reaction mixture was kept in the dark for 30 min, and Fv/Fm and Pm were measured. Data were normalized to Fv/Fm and Pm before rSP treatment, and are represented as the residual activities of PSII and PSI after rSP treatment. Data are expressed as mean ± se of three independent experiments.

