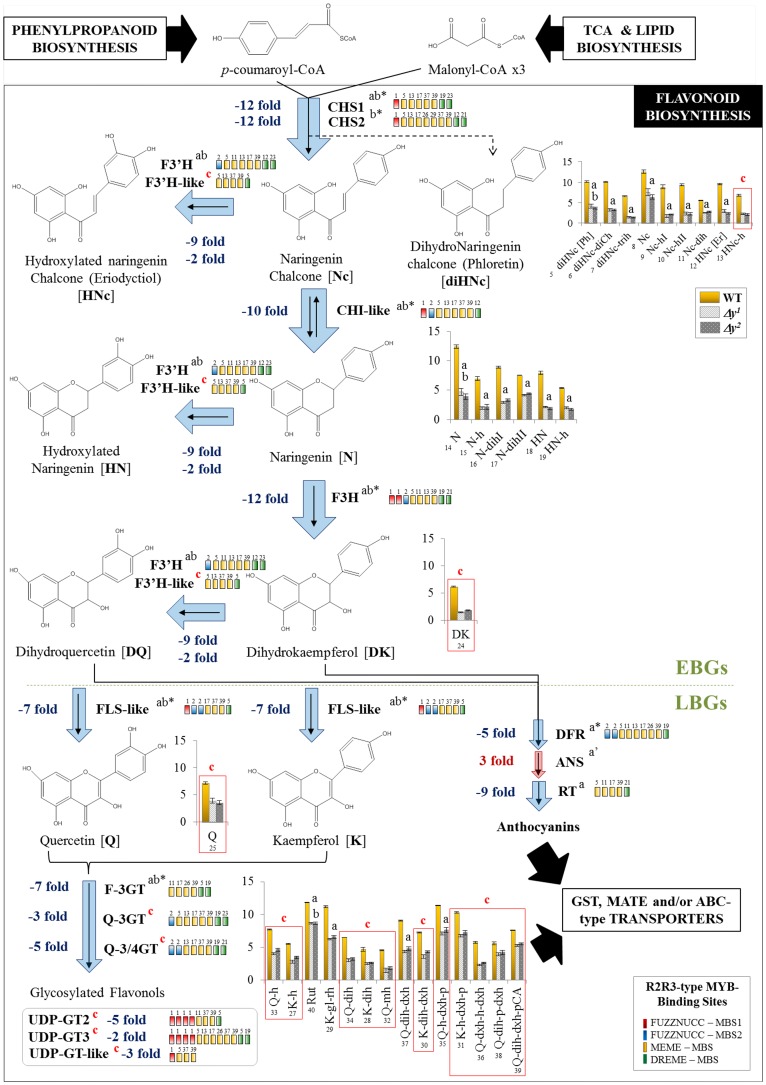
Figure 4.
Flavonol biosynthesis is blocked in the Δy mutants. Genes differentially expressed in the Δy mutants are indicated by blue (down-regulated) or red (up-regulated) arrows (thicker arrows represent a higher-fold change). The MBS motifs found in the promoter region of the down-regulated genes are also included (in colored boxes). Bar graphs show the metabolite levels for flavonols. The wild type is represented in yellow (left), the Δy1 mutant in dashed gray (middle), and the Δy2 mutant in dotted gray (right). Error bars are standard deviations (n = 3). Genes and metabolites differentially expressed also in the y mutant and in the other y lines are marked “a” and “b,” respectively, and those differentially expressed only in the Δy mutants are marked “c” (in red). Numbers in bar graphs correspond to metabolites in Supplemental Table S1. EBGs, early biosynthetic genes; N, naringenin; Nc, naringenin chalcone; HNc, hydroxylated naringenin chalcone (eriodictyol-chalcone); diHNc, dihydronaringenin chalcone (phloretin); HN, hydroxylated naringenin (eriodictyol); DK, dihydrokaempferol; DQ, dihydroquercetin; K, kaempferol; Q, quercetin; H, hexose; dxh, deoxyhexose; P, pentose; gl, Glc; rh, rhamnose; mh, malonyl-hexose; pCA, p-coumaric acid; Rut, rutin; a’, the ANS gene was down-regulated in the y mutant.

