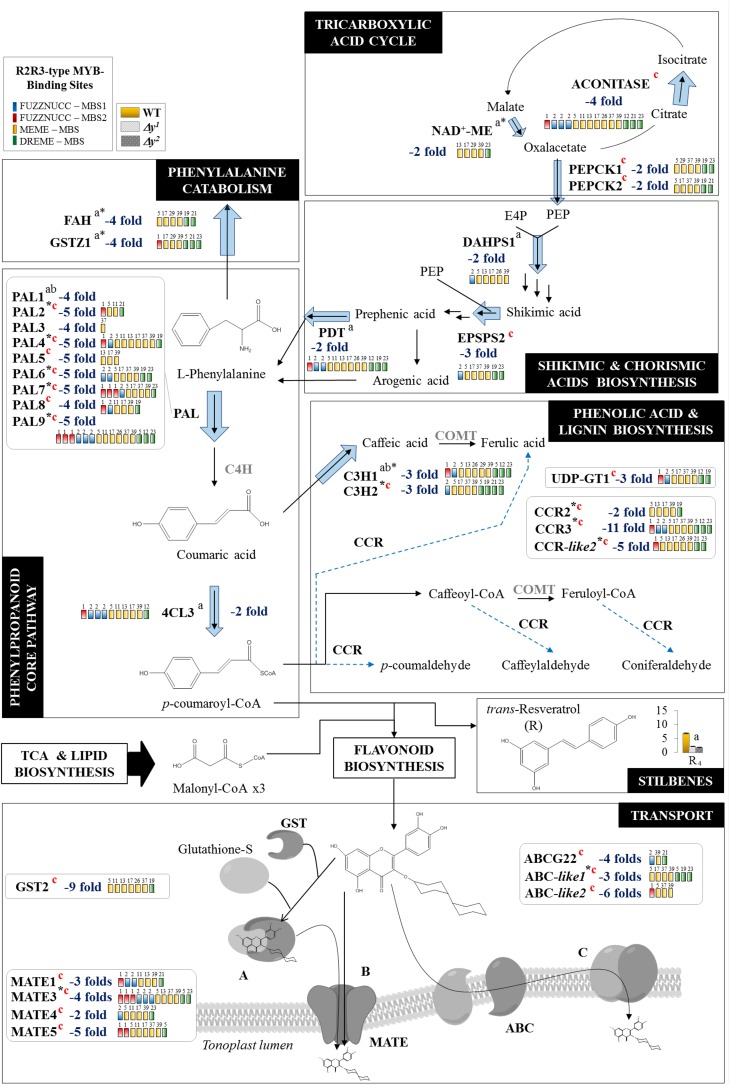
Figure 6.
Genes up- and downstream of flavonol biosynthesis are also affected in the Δy mutants. The figure represents the next biosynthetic processes upstream of flavonoid biosynthesis: TCA cycle; shikimate, chorismate, and arogenate pathways; core phenylpropanoid pathway; phenolic acid and lignin pathways; resveratrol biosynthesis; and l-Phe catabolism. In addition, the flavonoid transport process is shown downstream of flavonoid biosynthesis. Those genes differentially down-regulated (blue) are shown by arrows (the thicker the arrow, the higher the fold change). MBS motifs found in their promoters were also included (in colored boxes). Genes in gray were not differentially expressed in the Δy mutants. Genes and metabolites differentially expressed both in the y mutant and in other y-lines are marked “a” and “b,” respectively; those differentially expressed only in the Δy mutants are marked “c” (in red). NAD+-ME, NAD+-MALIC ENZYME; PDT, PREPHRENATE DEHYDRATASE; COMT, CAFFEIC ACID O-METHYLTRANSFERASE; HCT, CINNAMOYL COA TRANSFERASE; UDP-GT, GLUCURONOSYL TRANSFERASE.

