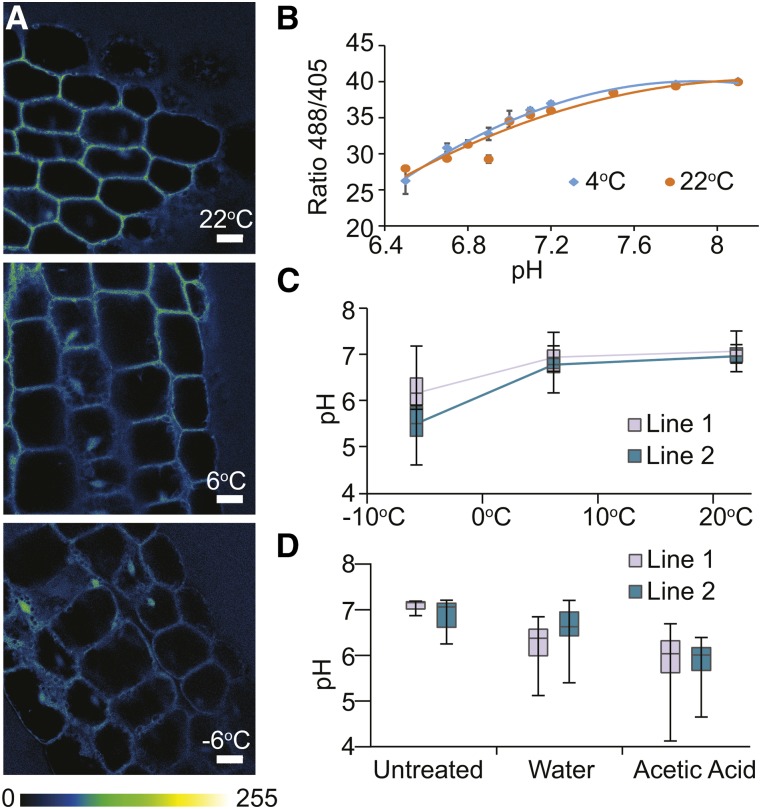
Figure 3.
Cytosolic pH changes during freezing and acetic acid treatment. A, Arabidopsis plants stably transformed with PtGFP were grown under control conditions (22°C), or grown and cold acclimated at 6°C for 1 week, or cold acclimated and frozen overnight at −6°C. A cold stage (4°C) was used to measure chilled plants. Ratiometric fluorescence was measured in hypocotyls, with excitation at 488 nm divided by excitation at 405 nm with detection constantly between 505 and 530 nm. Bars = 22 µm. B, Pure PtGFP protein was measured identically to A in microcapillaries at 22°C or on the cold stage (4°C) to provide a pH scale. C, Ratiometric fluorescence images of two independent lines of PtGFP, including those shown in A, were transformed into pH as described in “Materials and Methods” and are graphed according to most recently exposed temperature. Statistical significance values are as follows: 22°C versus 6°C (all samples), P = 0.0325; 6°C versus −6°C (all samples), P = 5 × 10⁻⁸; for line 1 individually: 22°C versus 6°C, P = 0.215; 6°C versus −6°C, P = 0.0006; for line 2 individually: 22°C versus 6°C, P = 0.0661; 6°C versus −6°C, P = 9 × 10⁻⁸. D, The same two independent lines of PtGFP used in C and A were untreated or floated on water or 20 mm acetic acid at pH 5 for 1 h, mimicking treatments in Figure 2. Statistical significance values are as follows: acetic acid versus water (all samples), P = 1.21 × 10⁻¹⁶; acetic acid versus untreated (all samples), P = 1.3 × 10⁻²⁴; water versus untreated (all samples), P = 1.09 × 10⁻⁹; for line 1 individually: acetic acid versus water, P = 0.0052; acetic acid versus untreated, P = 2.5 × 10⁻¹⁰; water versus untreated, P = 4.44 × 10⁻¹⁰; for line 2 individually: acetic acid versus water, P = 5.22 × 10⁻¹⁹; acetic acid versus untreated, P = 2.54 × 10⁻¹⁶; water versus untreated, P = 0.0023.

