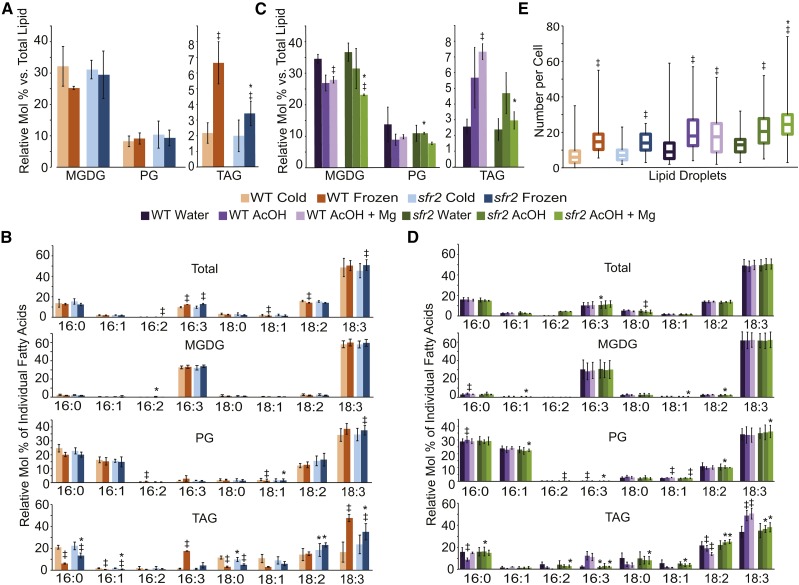
Figure 5.
pH and Mg2+ treatments mimic lipid changes due to freezing. A to D, Plants were grown at 22°C for 3 weeks and cold acclimated at 6°C for 1 week for all treatments (Cold). They were subsequently frozen at −6°C overnight (Frozen) or floated on 20 mm acetic acid, pH 5 (AcOH), 20 mm acetic acid, pH 5, with 10 mm magnesium chloride (AcOH + Mg), or water for 3 h. All plants were sampled as rosettes with roots removed. Molar percentage (A and C) of MGDG, PG, and TAG relative to total lipid amount and fatty acid profiles (B and D) of each lipid species relative to total fatty acids for each individual fatty acid were quantified. Values are biological replicate means ± sd. Each biological replicate consists of an average of three or four technical replicates. E, Lipid droplets were visualized with confocal microscopy after Nile Red staining and quantified as the number of lipid droplets per cell. Boxes encompass the interquartile range, with the central line representing the median. Whiskers represent maximum and minimum counts. For all data, significance (P ≤ 0.05) between control and treatment is represented by double daggers, and asterisks represent significance (P ≤ 0.05) between the wild type (WT) and sfr2.

