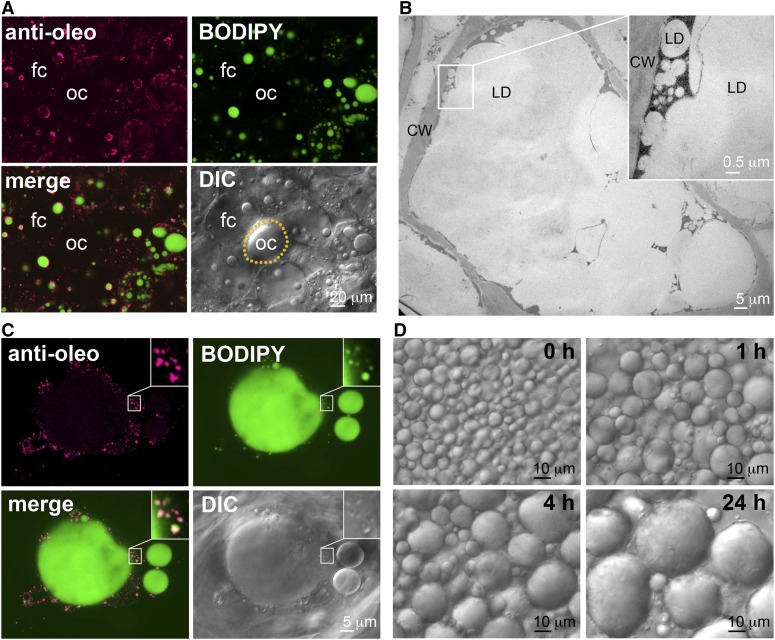
Figure 4.
Microscopy studies of LDs in avocado mesocarp. A, Immuno-CLSM image of avocado mesocarp cells at low magnification. The images show an oil cell (oc, circled with yellow dots for recognition) at the center adjacent to several fat cells (fc). BODIPY stained (in green) both the large and small LDs in the fat cells but not the large oil drop in the oil cell. Antibodies against avocado M oleosin reacted (in magenta) with the small but not the large LDs in the fat cells and did not react with any constituent in the oil cell. B, TEM image of a portion of an avocado fat cell, showing several large LDs with numerous small LDs on the periphery. Magnification of a junction between a large LD and numerous small LDs is shown on the top right. The LDs and cell wall are labeled. C, Immuno-CLSM image of a portion of an avocado mesocarp fat cell. The images show a large LD and numerous adjacent small LDs. Magnification of a junction between a large LD and numerous small LDs is shown on the top right. BODIPY stained (in green) large and small LDs. Antibodies against avocado M oleosin reacted (in magenta) mostly with the small LDs. In the merged image, oleosin appears more on the periphery of individual small LDs, resulting in a magenta coat enclosing a white matrix. D, Images of avocado LDs in an isolated fraction observed by light microscopy at time intervals. The LDs coalesced during the 24-h incubation. CW, cell wall.

