Figure 10.
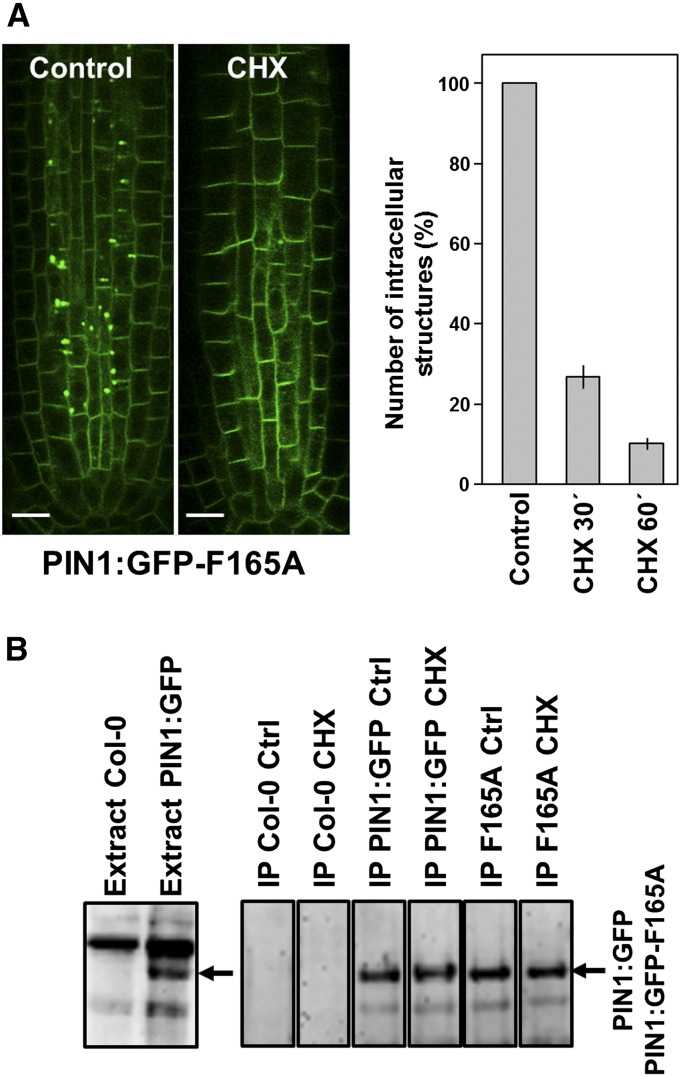
CHX treatment of PIN1:GFP and PIN1:GFP-F165A seedlings. A, The left images show CLSM analysis of primary roots of 4-d-old seedlings expressing PIN1:GFP-F165A treated with 100 μm CHX or dimethyl sulfoxide (Control) for 1 h. Bars = 10 μm. The graph at right shows a quantification of the number of intracellular structures in roots from the PIN1:GFP-F165A mutant after CHX treatment for 30 and 60 min expressed as a percentage of the number of intracellular structures in the absence of CHX (Control). n = 3 independent experiments, and at least 100 different seedlings were analyzed per condition. Error bars represent sd. B, Western-blot analysis of the amount of PIN1:GFP or PIN1:GFP-F165A with or without CHX treatment. The left gel shows the western-blot analysis of protein extracts from 5-d-old Col-0 and PIN1:GFP seedlings with GFP antibodies. A total of 30 μg of protein was loaded in each lane. The arrow points to the position of PIN1:GFP. The right gels show the western-blot analysis of immunoprecipitation (IP) experiments performed as described in “Materials and Methods” using mouse anti-GFP antibodies. Ctrl and CHX correspond to seedlings treated for 2 h with dimethyl sulfoxide and CHX, respectively. The arrow points to the position of PIN1:GFP or PIN1:GFP-F165A.

