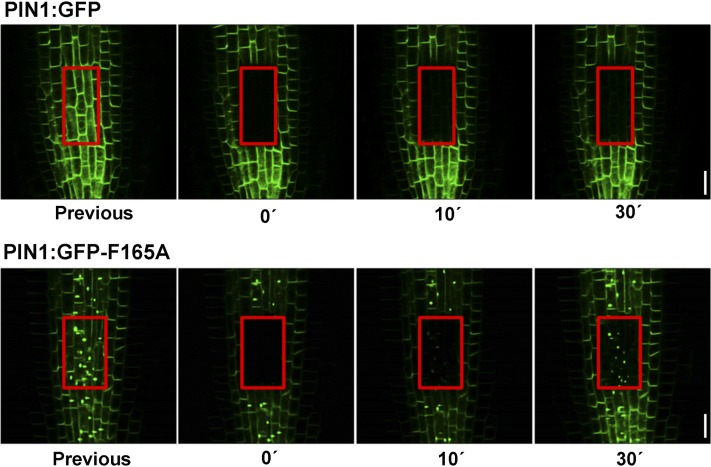
Figure 9.
Trafficking of newly synthesized PIN1:GFP-F165A. FRAP analysis is shown for PIN1:GFP (top) and PIN1:GFP-F165A (bottom) roots. Roots expressing PIN1:GFP or PIN1:GFP-F165A were imaged before and during recovery after bleaching an area containing stele cells. Images were taken at the indicated times after the bleach pulse (red squares). Bars = 10 μm.

