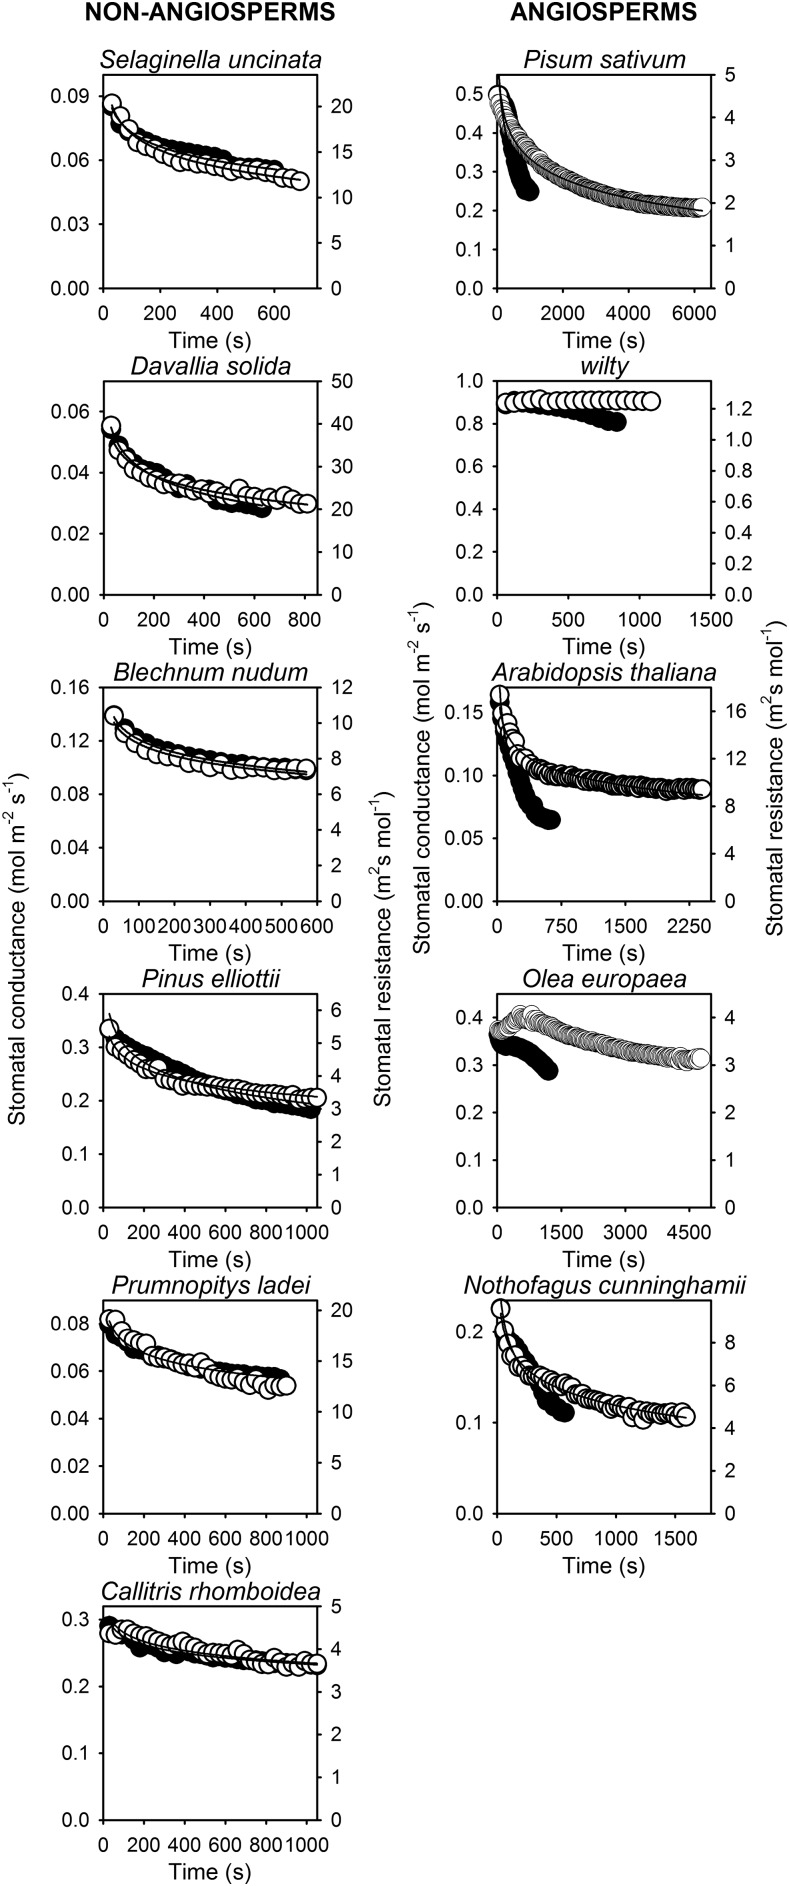
Figure 3.
The response of both stomatal conductance (black) to a step increase in VPD from 0.7 kPa to 1.5 kPa and stomatal resistance (white) to the reversed step change in VPD from 1.5 kPa to 0.7 kPa. Data were collected from the same leaf through a reversible sequence in VPD from 0.7 kPa to 1.5 kPa and returning to 0.7 kPa; in O. europaea a step change of 0.7 kPa to 2.2 kPa and returning to 0.7 kPa was used. Time zero for each trace marks the time of a change in VPD.

