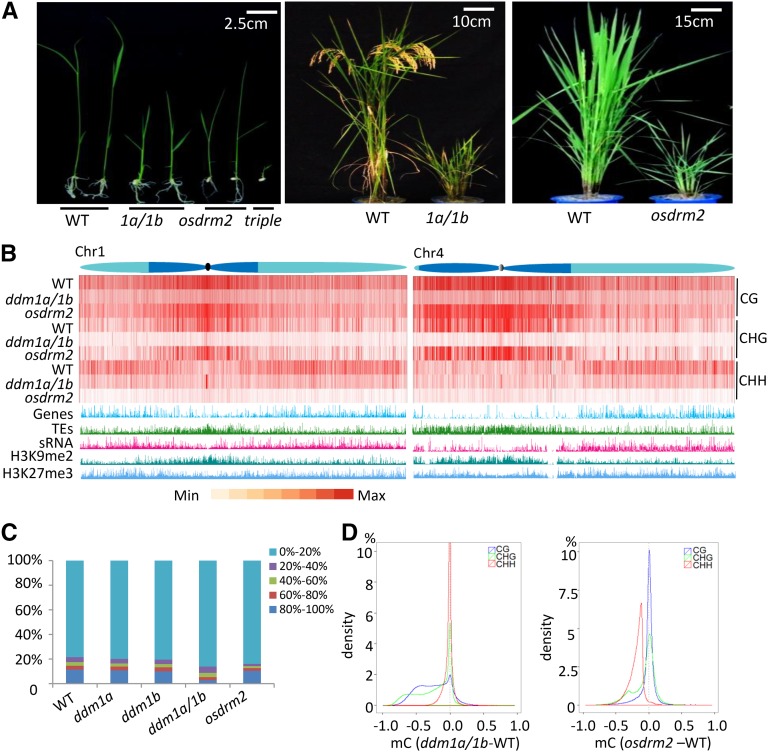
Figure 1.
Effects of the osddm1a/1b and osdrm2 mutations on plant growth and genome-wide cytosine methylation. A, The osddm1a/1b and osdrm2 mutations severely reduced plant height. Plants at seedling and mature stages are shown. The osdrm2 osddm1a/1b triple mutants were seedling lethal. B, Heat map of methylation levels at CG, CHG, and CHH sites in chromosomes 1 and 4 of the wild type (WT), osddm1a/1b, and osdrm2. Average methylation levels per 1-kb bin were calculated and are shown as red bars. The distribution of histones H3K9me2 and H3K27me3 and small interfering RNA (siRNAs) identified in this work are shown along the chromosomes. Genes and TEs are indicated. The heterochromatin (dark blue) and euchromatin (light blue) regions of the chromosomes are drawn according to Cheng et al. (2001). C, Effects of osdrm2 and osddm1a/1b mutations on cytosine methylation at different levels. Genome-wide cytosine methylation is divided into five intervals (from lowest [0%–20%] to highest [80% or greater], represented by the indicated colors). The percentage of each interval (detected in the wild type and the mutants) is shown on the y axis. D, Density plots of differential methylation levels at CG (blue), CHG (green), and CHH (red) sites in osddm1 (left) and osdrm2 (right) compared with the wild type. The y axis shows the percentage of differential methylation levels, and the x axis shows differential methylation levels (from −1 to +1) in the mutants relative to the wild type (0), with the area of each sequence context set as 100%. Only methylation differences for 1-kb windows containing at least five informative sequenced cytosines were considered.

