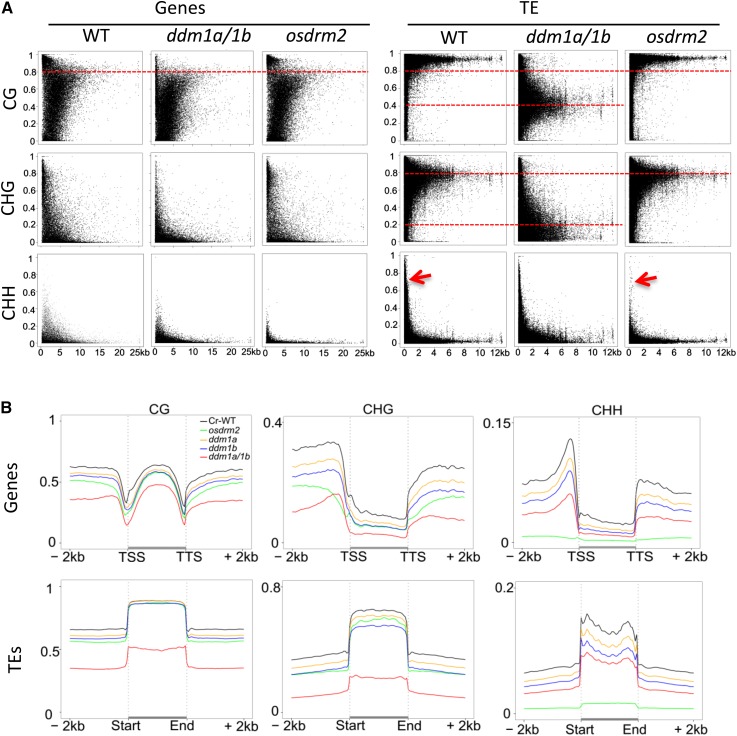
Figure 2.
Average cytosine methylation levels in all sequence contexts in genes and TEs. A, Average cytosine methylation levels in all sequence contexts plotted against gene (left) and TE (right) sizes. Note that high levels of wild-type (WT) CG methylation (greater than 80%) in genes and TEs were reduced to about 40% on average in osddm1a/1b, and wild-type CHG levels (80% on average) in TEs were reduced to lower levels (about 20% on average) in osddm1a/1b but remained unchanged in osdrm2, which mostly reduced CHH methylation in genes and small TEs (less than 1 kb; arrows). The percentage of methylated cytosines out of total cytosines of each protein-coding gene or TE was plotted in terms of the lengths of the elements. Each dot represents a gene or TE. B, Patterns and genome-wide average levels of cytosine methylation (CG, CHG, and CHH) of genes (top row) and TEs (bottom row) in wild-type and mutant rice plants. Protein-coding genes and TEs with their contiguous 2-kb upstream and downstream flanks were aligned at the 5′ and 3′ ends, and average cytosine methylation levels within each 100-bp interval are plotted.

