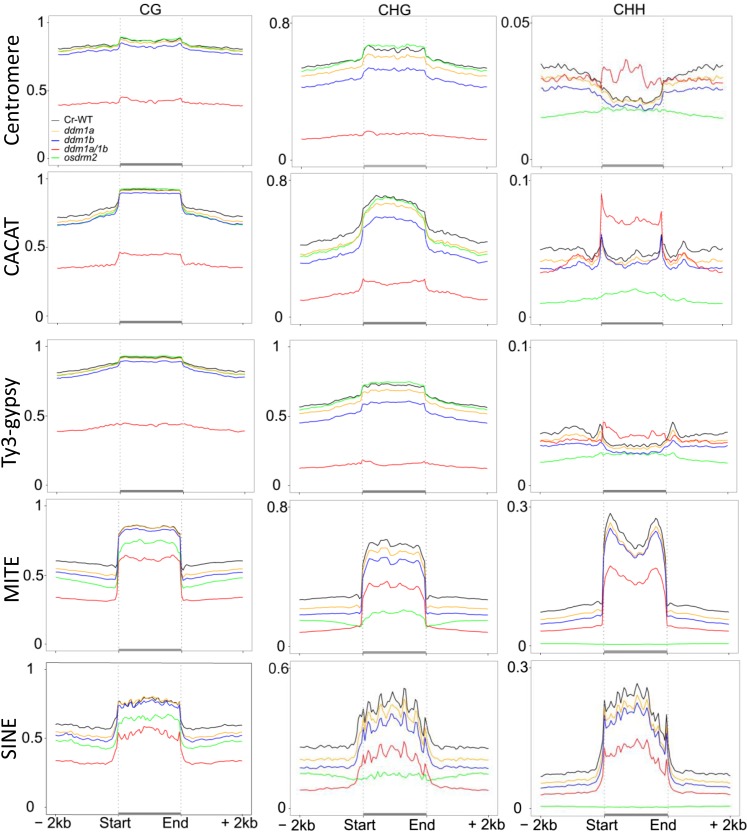
Figure 3.
Genome-wide average levels of methylation in each sequence context of the indicated TE families and repeats in culture-regenerated wild-type (Cr WT) and mutant plants. TEs with their contiguous 2-kb upstream and downstream flanks were aligned at the 5′ and 3′ ends, and average methylation for all cytosines within each 100-bp interval is plotted. Note the hyper-CHH methylation of centromere repeats, CACAT, and Ty3-gypsy retroelements in osddm1a/1b plants and the nearly complete losses of CHH and CHG methylation of MITEs and short interspersed nuclear elements (SINEs) in ordrm2 plants.

