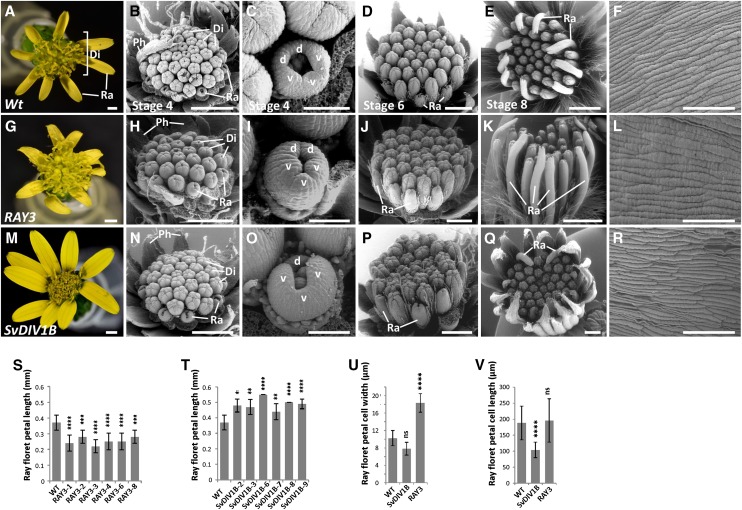
Figure 4.
Flower phenotypes of wild-type, RAY3, and SvDIV1B transgenic plants. A to F, Wild-type (nontransformed) control. G to R, RAY3 (G–L) and SvDIV1B (M–R) down-regulation capitulum and ray floret phenotypes. Di, Disc florets; Ra, ray florets; Ph, phyllaries; d, dorsal petal; v, ventral petal. Bars = 100 µm (C, F, I, L, O, and R), 500 µm (B, D, H, J, N, and P), and 1 mm (A, E, G, K, M, and Q). S to V, Quantitative ray floret phenotypic analysis of wild-type control, SvDIV1B, and RAY3 down-regulation plants. S and T, Ray floret length of wild-type control and several RAY3 and SvDIV1B transgenic lines, respectively. Down-regulation of RAY3 and SvDIV1B had antagonistic effects on ray floret petal length. Down-regulation of SvDIV1B significantly increased ray petal length, while RAY3 down-regulation decreased petal length in all transgenic lines. U and V, Average mature cell width and length of ray floret petal epidermal cells in wild-type control and in several SvDIV1B and RAY3 transgenic lines. U, Cell width was significantly increased in RAY3 down-regulated lines, while it was not changed in SvDIV1B transgenic lines. V, Down-regulation of SvDIV1B expression levels led to a significant ray floret petal cell length reduction, while RAY3 down-regulation had no effect. Error bars indicate sd values for n = 10 plants (S and T) and n = 20 plants (U and V) relative to wild-type controls. Asterisks indicate significance in two tailed Student’s t test when compared to the wild type: **P ≤ 0.01, ***P ≤ 0.001, ****P ≤ 0.0001, and nsP > 0.05 (ns, not significant).

