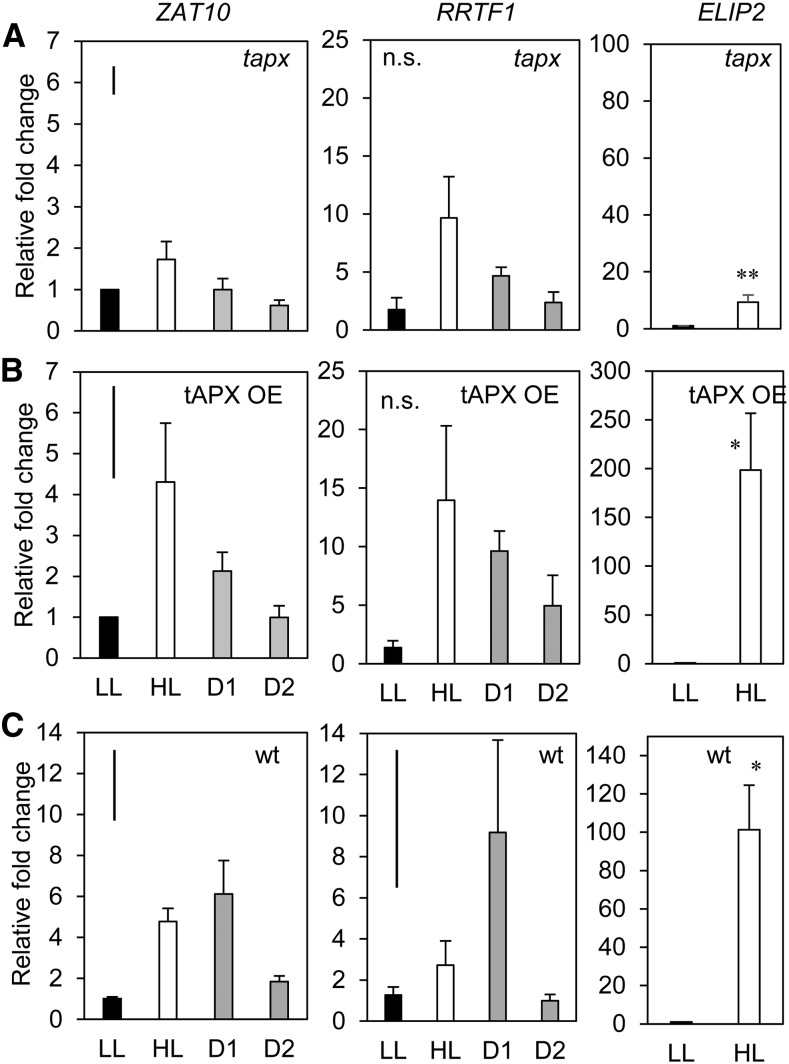
Figure 3.
Endogenous manipulation of the chloroplastic ROS environment using stable silenced and overexpressing tAPX lines. Transcriptional analysis of ZAT10, RRTF1 (SAA markers), and the ELIP2 HL marker in tapx 2/1 and the tAPX -14/2 overexpression lines compared to wild type (A) tapx-2/1, (B) tAPX-14/2, (C) wild type Col-0. LL, low light; HL, high light; D1, lower distal leaf position 5; D2, upper distal leaf position 7. One-way ANOVAs were performed on each ZAT10 data set, post hoc Fisher's lsd results are displayed as a bar in the top left corner of each plot. t test were performed on ELIP2 data sets. *p < 0.05 *P < 0.005. Error bars represent se, n = 3.

