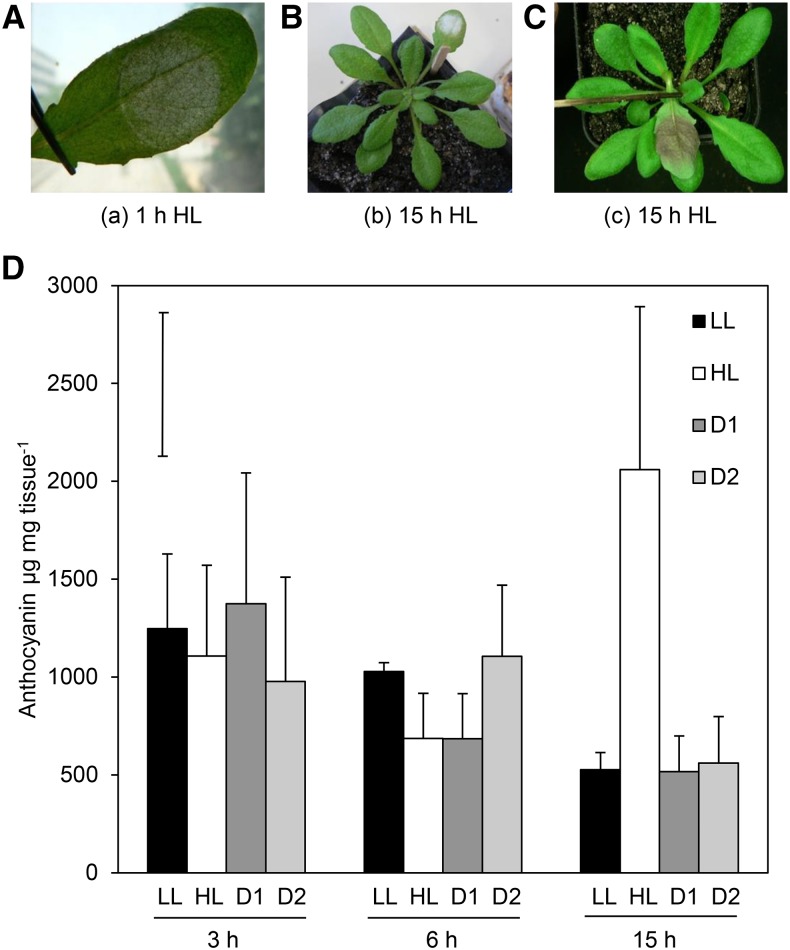
Figure 5.
Visual HL stress marker and anthocyanin accumulation time course in local and distal tissue. A, Effect of 1 h HL on leaf tissue; B, photobleaching, 15 h HL; C, anthocyanin accumulation, 15 h HL; D, quantification of anthocyanin accumulation after 3, 6, and 15 h of continuous 1000 μmol photons m−2 s−1 HL, where black, LL control; white, HL-treated leaf at insertion 6; pattern, distal tissues at leaf positions 5 and 6, respectively. n = 3 samples of three pooled plants. Bar in top left corner represents Fischer's lsd post hoc test after one-way ANOVA (where P = 0.006). Error bars represent SD.

