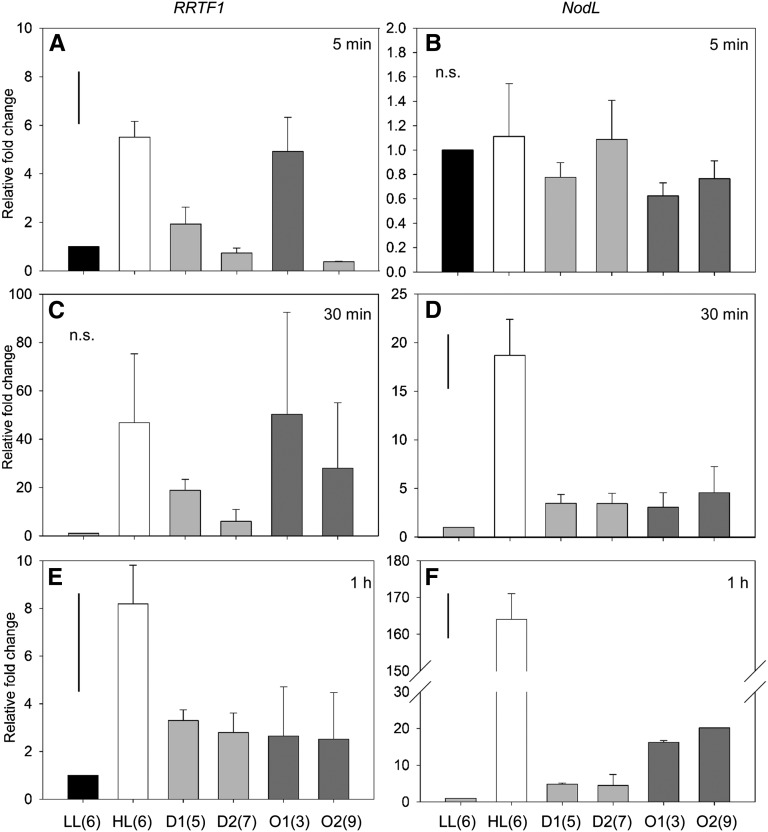
Figure 8.
Time course of RRTF1 and NodL expression in orthostichous tissue. qRT-PCR of RRTF1 and NodL expression after HL treatments of (a) 5 min, (b) 30 min, and (c) 1 h. LL, leaf 6; HL, leaf 6; D1 and 2, distal leaves 5 and 7 respectively; O1 and 2, orthostichous leaves 3 and 9 respectively. Bar in top left represents Fischer's lsd after one-way ANOVA. n = 3.

