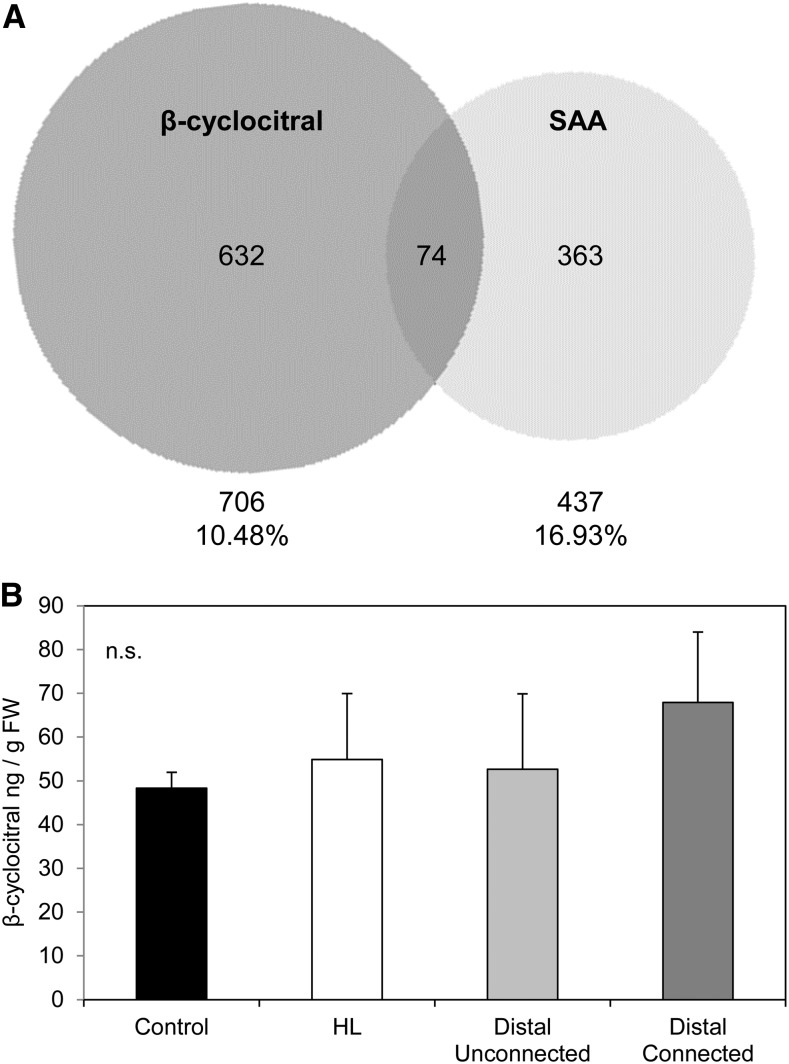
Figure 9.
β-cyclocitral and SAA microarray comparisons and accumulation of compound under localized HL. A, Comparison of β-cyclocitral and SAA microarrays. Venn diagram of the β-cyclocitral microarray from Ramel et al., (2012) compared to the Rossel et al. (2007) SAA microarray. Total genes and percentages of shared genes are indicated under each data set. B, β-cyclocitral measurements from LL and LED-treated 1500 μmol photons m−2 s−1 HL leaf tissue. Relative changes of β-cyclocitral in local and distal tissues. Data are mean values of three independent measurements, SD = standard deviation.

