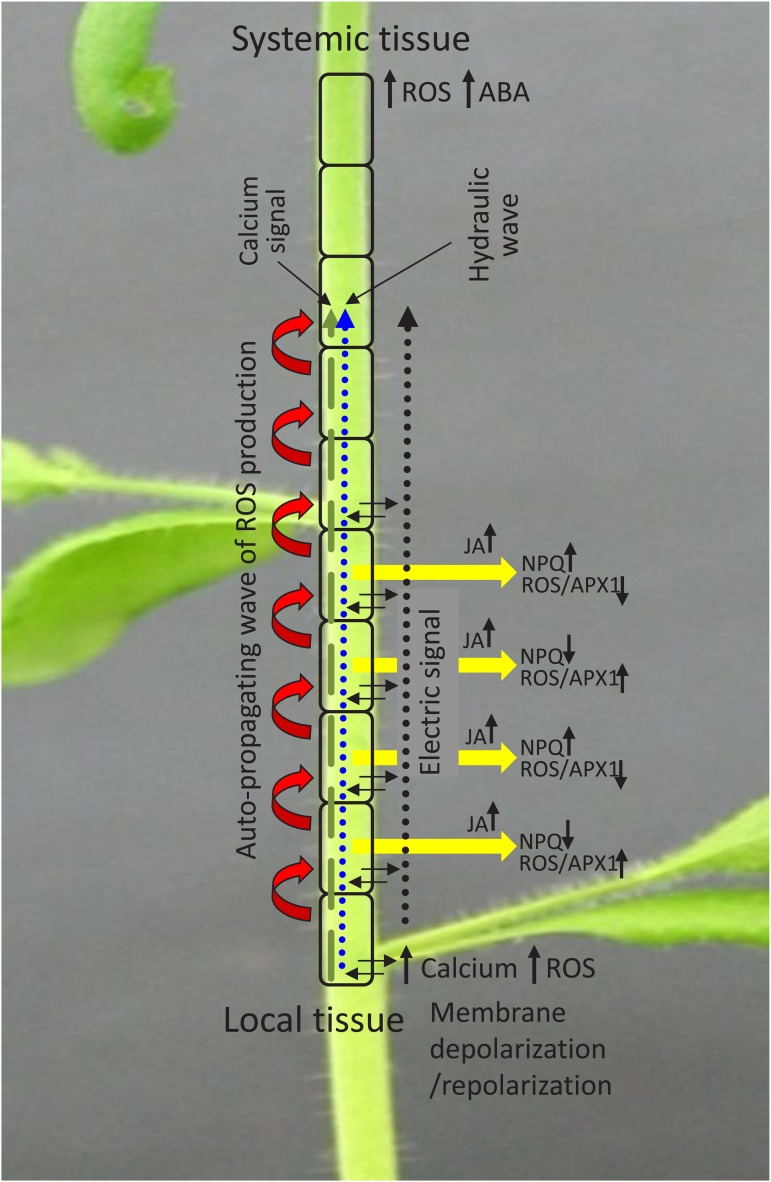
Figure 2.
Copropagation of the ROS, calcium, hydraulic, and electric waves during rapid systemic signaling. The ROS wave is shown as a series of red arrows, the calcium wave is shown as a dashed green arrow, the hydraulic wave is shown as a dotted blue arrow, and the electric wave is shown as a dotted black arrow. Different sections along the path of the signal (yellow arrows) are also shown to have alternating levels of NPQ and ROS/APX1 levels, and JA is shown to accumulate in cells along the systemic path. The local tissue is shown to have alterations in ROS, calcium, and membrane depolarization potential, and the systemic tissue is shown to have accumulation of ROS and abscisic acid (ABA). Black arrows indicate accumulation or suppression in the level of a particular chemical or transcript/protein, and dashed, dotted, and wide red arrows indicate direction of the signal.

