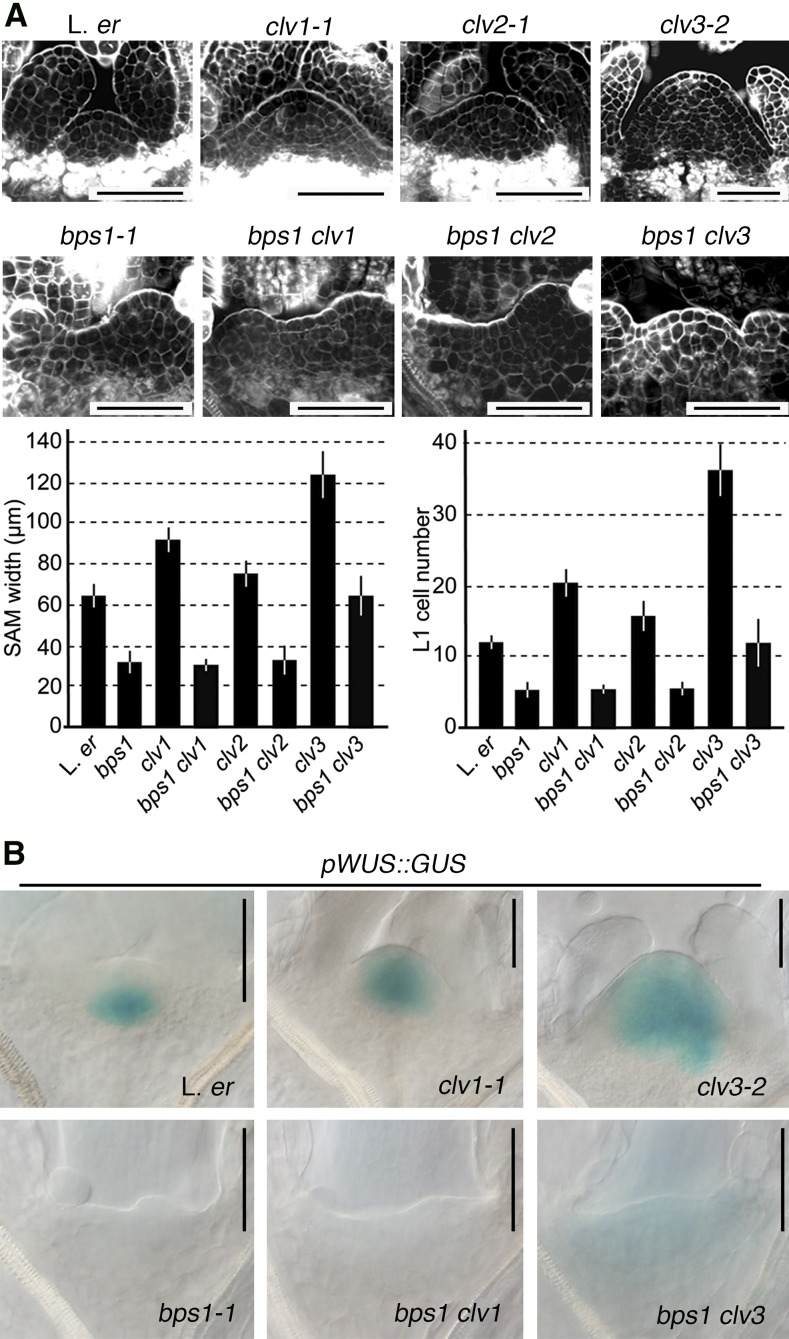
Figure 4.
CLV3 peptide signaling and the bps signal are independent negative regulators of pWUS::GUS expression. A, Confocal images depict the SAM of single and double mutants (top) and a quantitative analysis of SAM size at 5 dpi. Graphs depict data from 17 to 20 seedlings for each genotype and are shown as the mean ± sd. B, pWUS::GUS expression in single and double mutants at 5 dpi. Bars = 50 µm.

