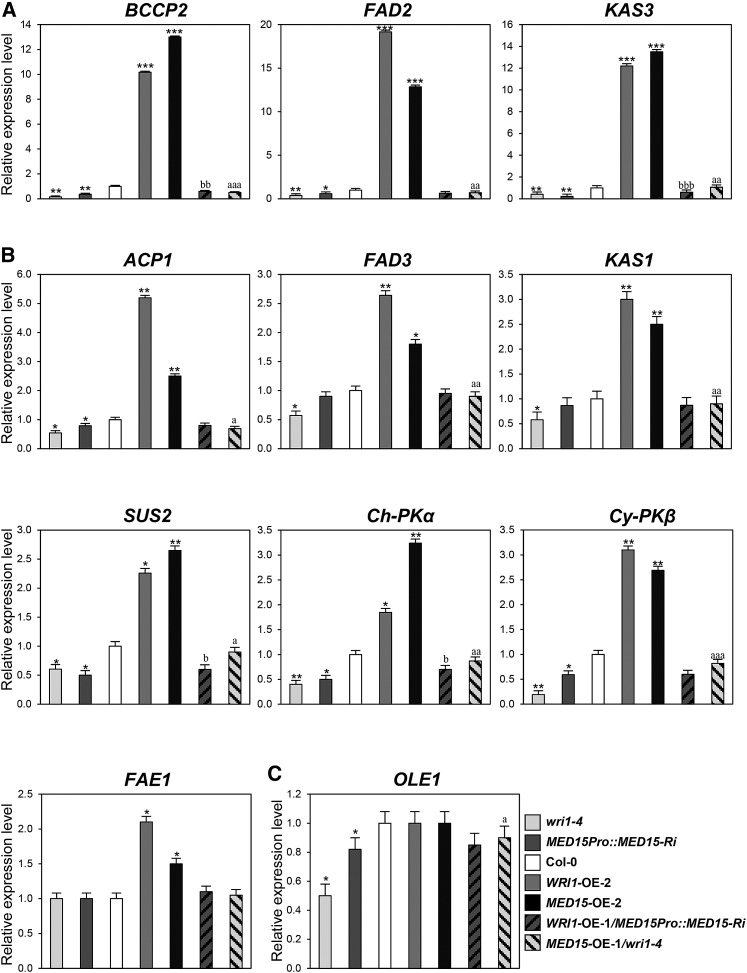
Figure 5.
Expression profiles of fatty acid biosynthetic genes in transgenic Arabidopsis plants with different MED15 and WRI1 transcript levels. A, Expression levels of BCCP2, FAD2, and KAS3 in wild-type Col-0, wri1-4, MED15Pro::MED15-Ri, WRI1-OE-2, MED15-OE-2, WRI1-OE-1/MED15Pro::MED15-Ri, and MED15-OE-1/wri1-4 transgenic plants. B, Expression levels ACP1, FAD3, KAS1, SUS2, Ch-PKα, Cy-PKβ, and FAE1 in wild-type Col-0, wri1-4, MED15Pro::MED15-Ri, WRI1-OE-2, MED15-OE-2, WRI1-OE-1/MED15Pro::MED15-Ri, and MED15-OE-1/wri1-4 transgenic plants. C, Expression levels of OLE1 in wild-type Col-0, wri1-4, MED15Pro::MED15-Ri, WRI1-OE-2, MED15-OE-2, WRI1-OE-1/MED15Pro::MED15-Ri, and MED15-OE-1/wri1-4 transgenic plants. Two-week-old Arabidopsis seedlings were used for qRT-PCR analysis. The expression values were normalized using ACTIN1 as an internal control. Each experiment was repeated with three biological replicates. Student’s t test: *, P < 0.05, **, P < 0.01, or ***, P < 0.001 versus wild-type Col-0; a, P < 0.05, aa, P < 0.01, or aaa, P < 0.001 versus wri1-4; b, P < 0.05, bb, P < 0.01, or bbb, P < 0.001 versus MED15Pro::MED15-Ri. Error bars represent sd.

