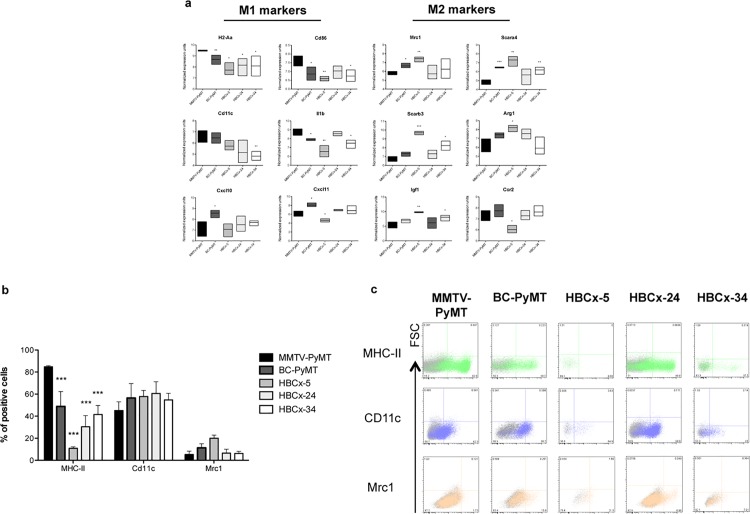
Fig 4. M1/M2 macrophage-like cell phenotype in BC tumors.
(a) The expression of genes associated with the M1 (MHC-II, CD86, Cd11c, Il1b, Cxcl10 and Cxcl11) or M2 (Mrc1, Scara4, Scarb3, Arg1, Igf1 and Ccr2) phenotype was assessed by the dissociation of five tumors (MMTV-PyMT, BC-PyMT, HBCx-5, -24 and -34), the sorting of macrophage-like cells, and microarray analysis. Levels of gene expression in BC models were compared in unpaired Student’s t-tests (b) Protein levels for M1 (MHC-II and Cd11c) and M2 (Mrc1) markers on macrophage-like cells from the five tumors MMTV-PyMT, BC-PyMT, HBCx -5, -24 and x-34), as measured by flow cytometry. Three tumors were analyzed per model. For each model, Mann-Whitney tests were performed to compare the results obtained with those for the MMTV-PyMT tumor (* p< 0.05, **p <0.01, ***p <0.001). (c) Examples of flow cytometry findings for the levels of M1 and M2 marker proteins (the corresponding isotype is shown in gray).

