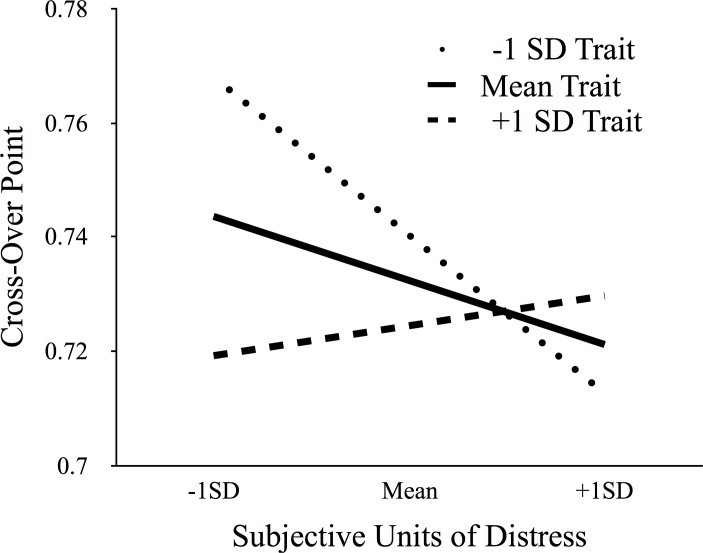
Fig 3. Cross-over Points as a Function of Fear.
Cross-over points, or the largest gap at which participants stepped normed to eye-height, is plotted against state levels of fear (mean, +/- 1SD) for three values of trait fear (average, +/-1SD indicates high or low). Higher trait individuals were cautious, opting to step across only relatively smaller gaps. Lower trait fear individuals acted more cautiously when experiencing higher state fear than when experiencing lower state fear.

