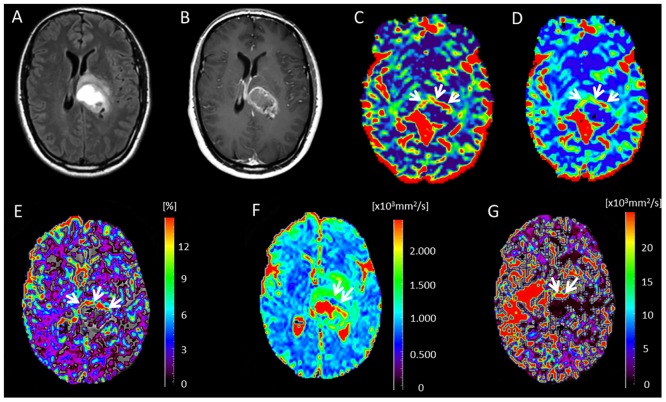
Fig 1. Glioblastoma in a 62-year-old woman.
(A) Axial FLAIR image. (B) Contrast-enhanced T1-weighted image shows a rim-enhancing tumor. (C) Cerebral blood flow map obtained with DSC-MRI shows hyperperfusion signals predominantly in the left margin of the tumor (arrows). (D) DSC cerebral blood volume map. The hyperperfusion signal intensities correlate with those seen on cerebral blood flow map. (E) f map clearly highlights the area with high perfusion in the margins of the tumor (arrows), which is more evident than in C and D. (F) D map shows small restricted diffusion area (average D value = 0.895 x 10⁻³ mm2/s) predominantly in the anterior tumor margin (arrows). (G) D* map shows increased fast-diffusion values in the tumor tissue (arrows).

