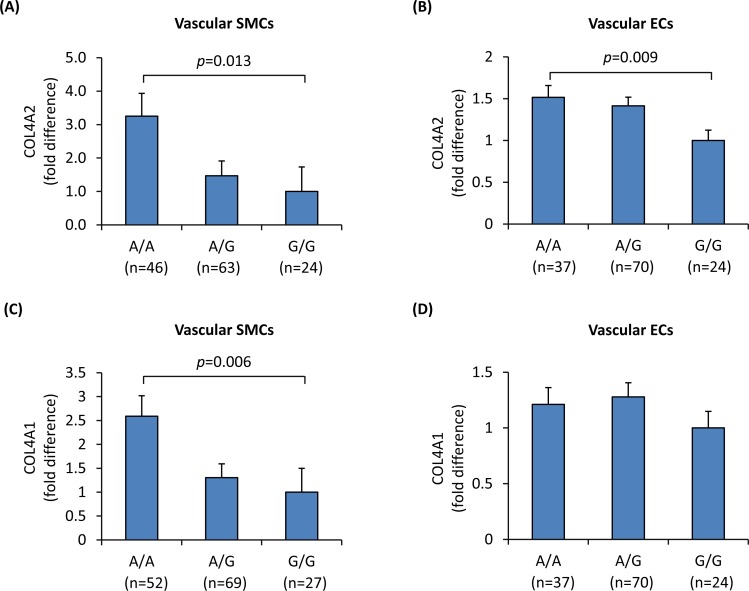
Fig 1. Influence of SNP rs4773144 genotype on COL4A2 and COL4A1 expression levels.
Primary cultures of vascular SMCs and ECs from different individuals were genotyped for rs4773144 and subjected to quantitative reverse transcriptase–polymerase chain reaction analysis of COL4A2 and COL4A1. Showed in the graphs are relative fold differences in COL4A2 (A and B) and COL4A1 (C and D) RNA levels in SMCs (A and C) and ECs (B and D), respectively. Columns and error bars represent mean and SEM values; p-values shown are for an additive genetic model.

