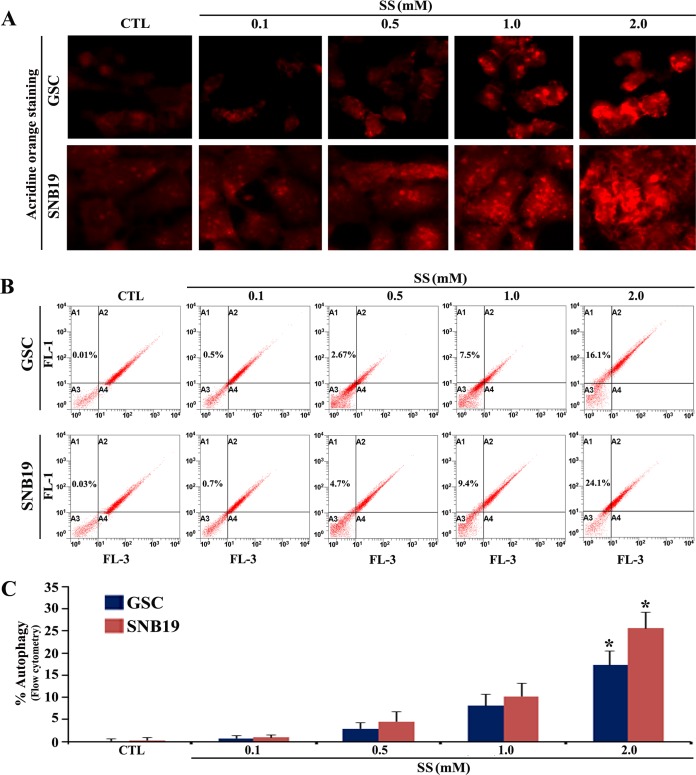
Fig 1. The AO staining to show induction of autophagy after exposure of GSC and SNB19 cells to SS.
Overnight grown GSC and SNB19 cells were exposed to 0.1, 0.5, 1.0, and 2 mM SS for 24 h. Untreated cells were considered as control (CTL). (A) Staining of cells with AO followed by fluorescence microscopy for detection of AVO in autophagic cells. (B) Flow cytometric analysis of the AO stained cells from all treatment groups for detection and determination of AVO in autophagic cells. (C) Quantitative analysis of the autophagic cell populations shown in bar diagrams on the basis of flow cytometric data. Significant difference between CTL and any treatment was indicated by *P < 0.05.

