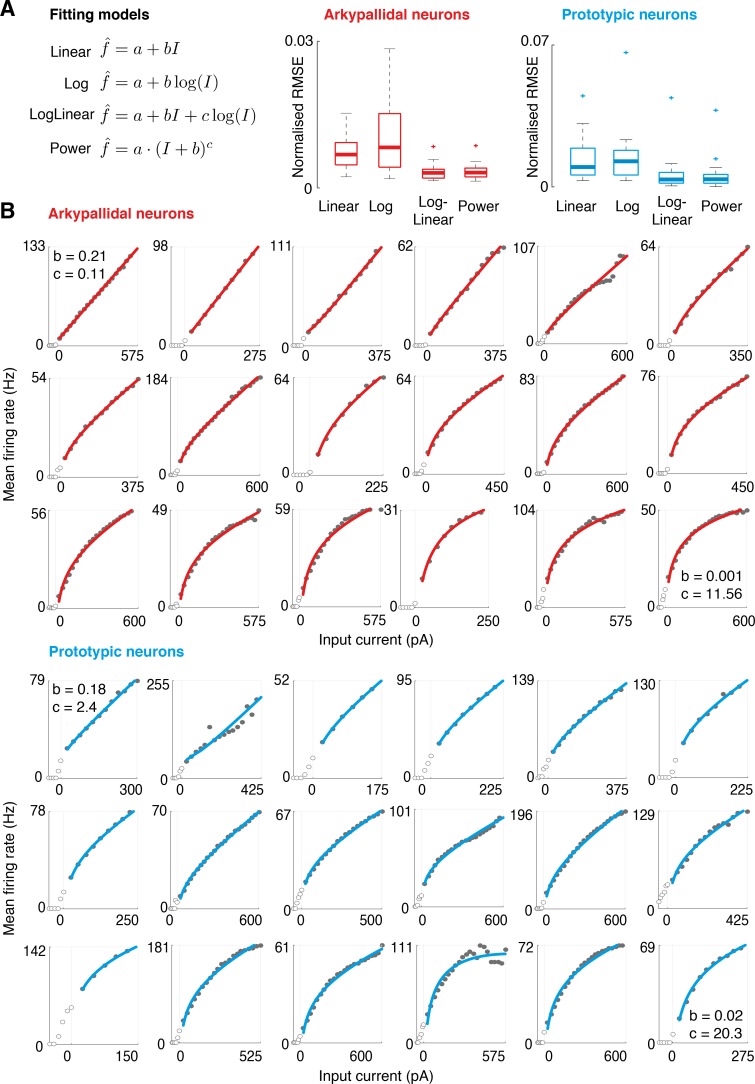
Fig 4. Linearity and non-linearity of f-I curves of GPe neurons.
(A) Comparison of quality of fits of f-I curves of arkypallidal or prototypic neurons to 4 different functions (linear, logarithmic, a combination of logarithmic and linear, or a power function). The fits were assessed by root mean squared error (RMSE). Note that the best fits (lowest RMSE values) arose from using the combination of logarithmic and linear as well as from the power function. Plots indicate medians plus IQRs for all neurons of each type. (B) Individual fits for all f-I curves recorded in arkypallidal (n = 18) and prototypic (n = 18) neurons. Traces are sorted from most linear (top left) to logarithmic (bottom right) for each population. Only positive responses are considered, since log x is undefined for x≤0. In the displays showing the most linear and the most logarithmic neurons, the values of coefficients in fitted function f = a + bI + clogI are printed. The logarithmic coefficient c has relatively high values even for the most linear neurons, because function logI has much smaller range for a given input than the linear function I.

