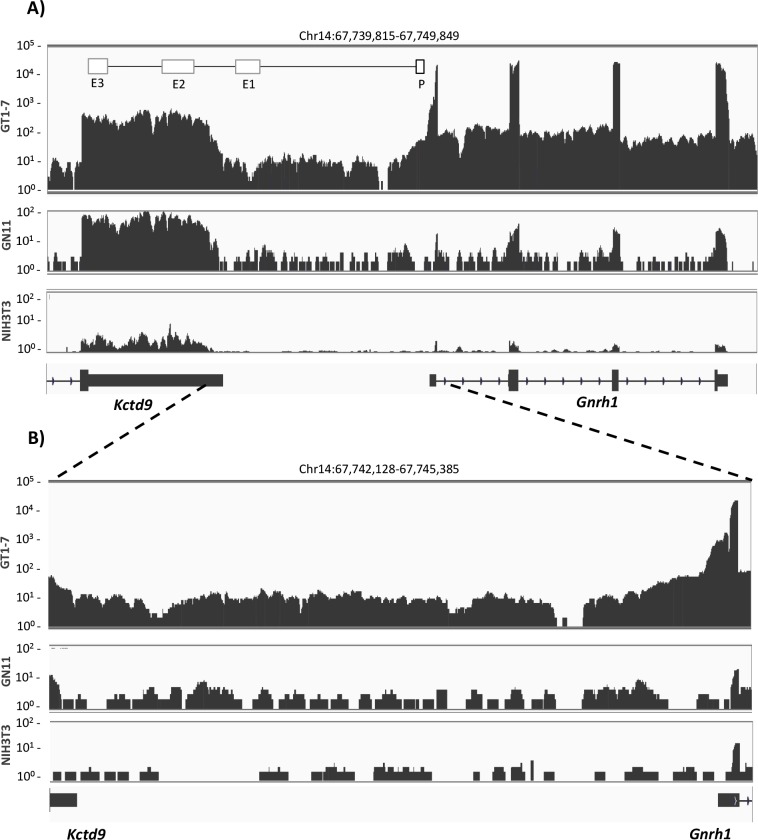
Fig 1. RNA sequencing analysis of the upstream regulatory region of the Gnrh1 gene.
(A-B) RNA expression in GnRH model cell lines GN11 and GT1-7, and NIH3T3 mouse fibroblasts are displayed in tracks as labeled. The tracks show the number of sequence reads on the y-axis, aligned to chromosome location on the x-axis. The RNA reads are displayed in log scale: 1–105 for GT1-7 cells, and 1–102 for GN11 and NIH3T3 cells. (A) RNA sequencing analysis of the mouse Gnrh1 gene and the upstream intergenic region between Kctd9 and Gnrh1 is shown. RNA reads are aligned to Gnrh1, the upstream intergenic region, and the 3’ untranslated region (UTR) of Kctd9 (mouse Chr14:67,739,815–67,749,849 of the mouse mm10 genome assembly). A schematic diagram of the Gnrh1 enhancers (E1, E2, E3) and promoter (P) are shown in the GT1-7 track, and are aligned to the 3’ UTR of Kctd9 and the genomic region that is 5’ of Gnrh1. (B) An enlarged display of RNA reads aligned to the intergenic region located upstream of Gnrh1 and the 3’ UTR of Kctd9 (mouse Chr14: 67,742,182–67,745,385).

