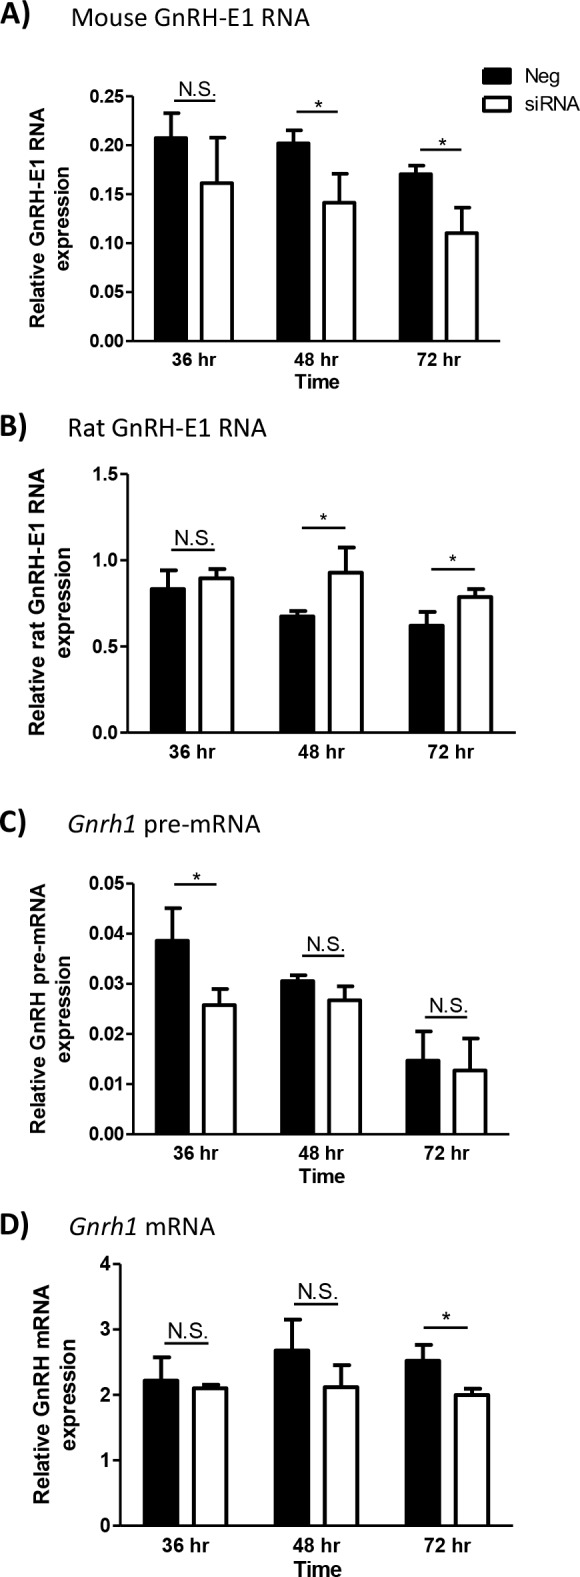
Fig 6. The effect of GnRH-E1 RNA knockdown on Gnrh1 gene expression.

(A-D) GT1-7 neurons were transfected with either negative siRNA control (Neg; black bars) or siRNA targeting both strands of the mouse GnRH-E1 RNA (siRNA; white bars). Total RNA was harvested at 36 hours, 48 hours, and 72 hours after siRNA transfection. RT-qPCR analysis was performed to quantify endogenous mouse GnRH-E1 RNA (A), transgene-derived rat (rTg) GnRH-E1 RNA (B), Gnrh1 pre-mRNA (C), and Gnrh1 mRNA (D) expression. Relative RNA expression is normalized to control histone 2A.Z (H2afz) mRNA expression at each time point. Data are displayed as the mean ± SD, where statistical significance was determined by Student’s t-test compared between negative control and siRNA treatment at each time point. Asterisk indicates statistical significance, where p<0.05.
