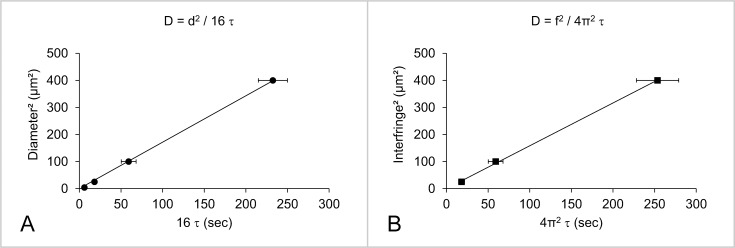
Fig 3.
Diffusion coefficient (D) of DOPE-Rho lipids in the outer leaflet of a supported DOPC lipid bilayer deduced by varying the area of the bleached region (disks of diameters d = 2, 5, 10 or 20 μm in A; networks of fringes with an interfringe f = 5, 10 or 20 μm in B). The linear relationship between the bleaching area s2 (d2 or f2) and the recovery time (τ) proves that lipid diffusion is controlled by Brownian motion. The diffusion coefficient (D) is calculated from the slope of this straight line: D = d2 / 16 τ in the case of the disk system, and D = f2 / 4π2 τ in the case of the fringe system. Each data point in A or B is the average of N = 3 independent bleaching experiments on different regions of the same bilayer, and the error bars correspond to the standard deviations from these averages. These experiments were reproduced with 4 independent (freshly prepared) bilayers using either the disk- or the fringe-shaped bleaching geometry, leading to D = (1.9 ± 0.3) μm2/s.

