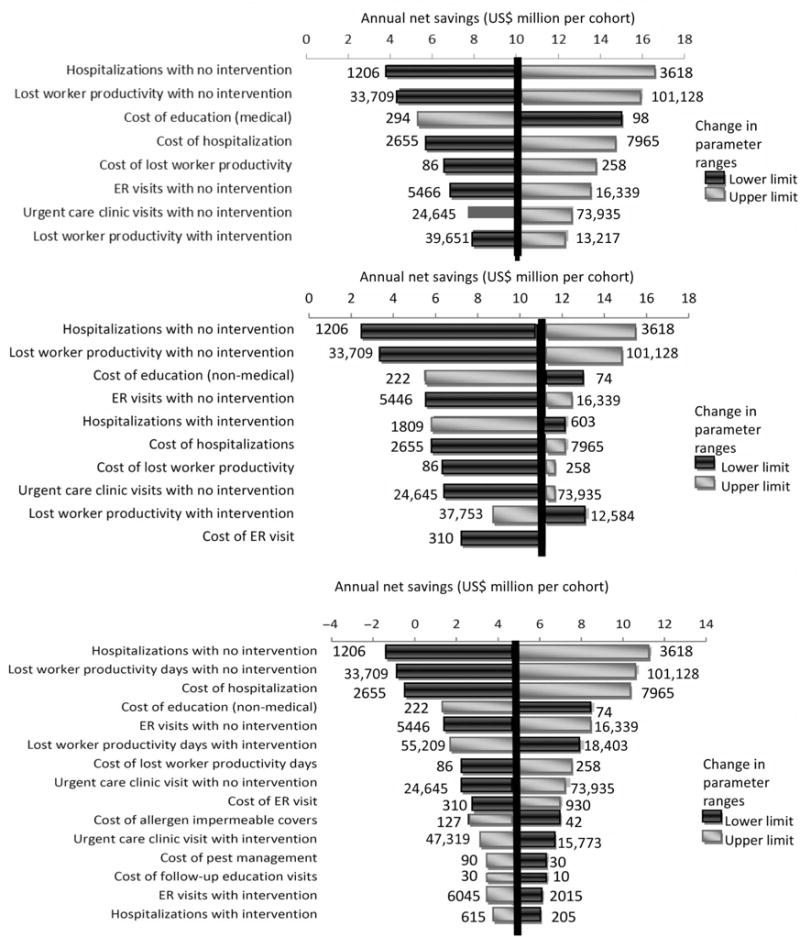
Figure 2.

One-way sensitivity analyses. The upper and lower input ranges yielding the changes in annual net savings are represented at the side of each horizontal directional bar. All variables depicted altered the net benefit by at least 20% from base case estimates as noted by the linear vertical line. Net savings are benchmarked against the no intervention approach. The upper, middle and lower panels represent interventions using environmental education by medical providers, environmental education by non-medical providers, and the multi-component intervention, respectively. Costs are in 2009 US dollars.
