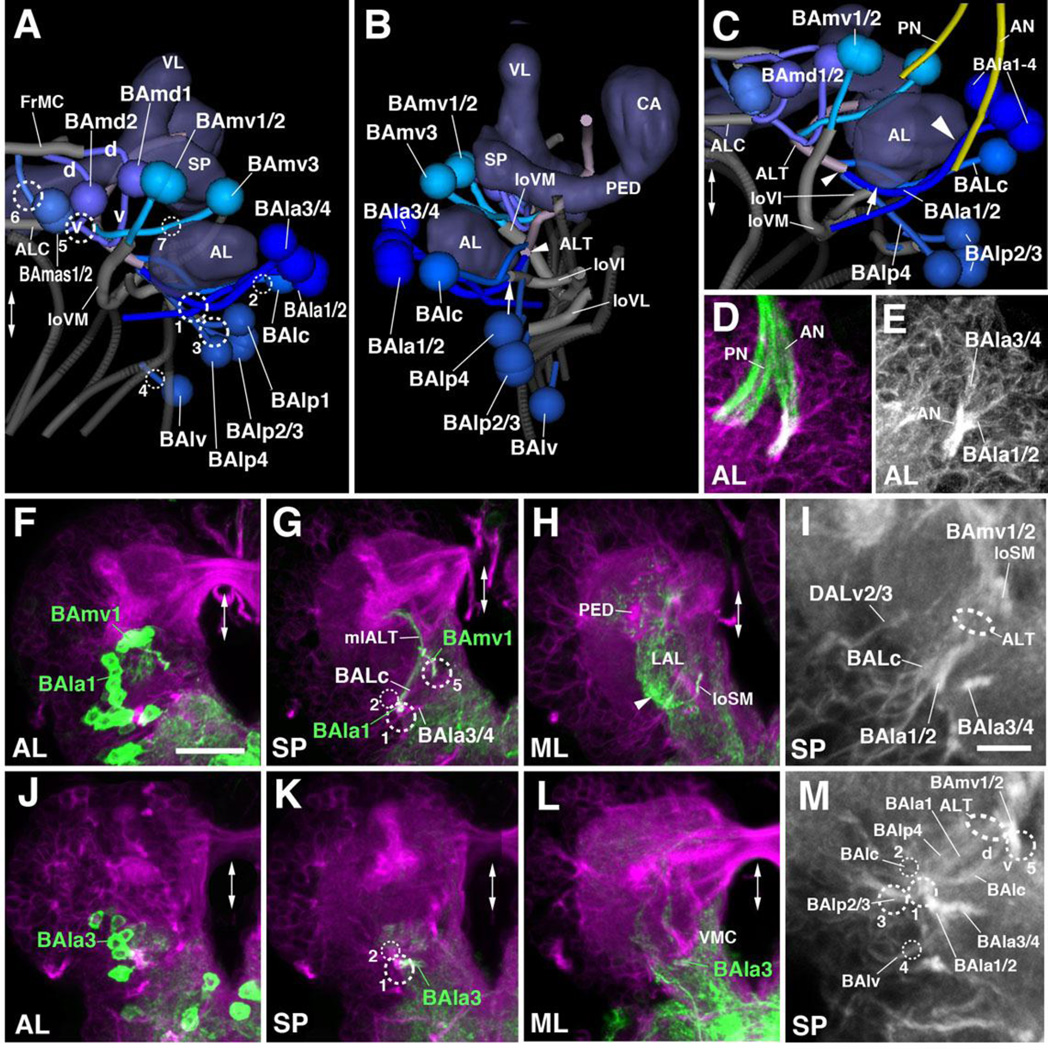
Figure 5. Tracts associated with baso-anterior (BA) lineages.
(A–C): Digital 3D models of BA lineages and tracts in a single L1 brain hemisphere. Anterior view (A), lateral view (B), ventro-anterior view (C). Centers of cell body clusters of lineages are depicted as spheres; lineage-associated axon tracts are shown as lines. Mushroom body and antennal lobe (blue-gray) and FasII-positive tracts (dark gray) are shown for reference. Fiber bundles of neuropil formed by BA lineage tracts are shown in light gray. Numbered hatched circles in (A) and other panels represent entry portals of lineage-associated tracts. “d” and “v” in (A) indicate dorsal and ventral hemilineage tracts of BAmd1 and BAmd2, respectively. Arrow in (B, C) points at entry of ventral hemilineage of BAlc into loVI tract; small arrowhead in (B, C) indicates convergence of tracts of BAla1, BAlc, and BAlp4 into the antennal lobe tract (ALT); large arrowhead in (C) points at close parallel entry of antennal nerve (AN) and tracts of BAla1–4. Double-headed arrow in (A, C) and all other panels indicates brain midline. (D–M) Z-projections of frontal confocal sections of a single L1 brain hemisphere. Antero-posterior levels shown by z-projections are indicated by letters (AL, SP, ML) at lower left corner (for definition of levels, see Figure 2). Primary neurons and tracts are labeled by anti-Neuroglian (BP104; magenta in panels D, F–H, J–L; white in panels E, I, M). BP104-positive antennal nerve (AN) and pharyngeal nerve (PN) is highlighted in green in panel (D). Lineages BAmv1 and BAla1 are labeled by per-Gal4>UAS-mcd8::GFP (green in F–H); BAla3 is labeled by en-Gal4>UAS-mcd8::GFP (green in J–L). Panels (I) and (M) are high magnifications of central parts of (G) and (K), respectively. For abbreviations of compartments and fiber tracts see Table 1; for numbering of entry portals see Table 2. Bars: 10µm (D, E, I, M); 20µm (F–H; J–L)

